Consumer Sentiment Survey Spring 2025
Back to All Insights
U.S. Consumers Show Cautious Spending Behavior In An Uncertain Economy

In April 2025, A&M Consumer and Retail Group surveyed over 1,600 U.S. consumers to assess their financial outlook, spending and saving plans, loyalty program engagement and shopping behaviors. Our findings show that consumer sentiment remains cautious entering the spring, continuing the trend of financial conservatism observed since last fall.
This spring, consumer behavior is increasingly driven by a desire for value and financial stability, with shoppers making more intentional purchasing decisions, reassessing brand loyalty, and prioritizing practical choices across both essential and discretionary categories.
- A widening financial divide is shaping behavior
Higher-income consumers plan to spend more; medium-to-lower-income groups are cutting back, even on essentials - Consumers are prioritizing value over volume
Shoppers are trading down and prioritizing affordability over brand loyalty - Store brands are gaining trust and momentum
Viewed as smart choices, not compromises, with growing trust and usage - Spending is cautious, but curiosity remains
Despite cutbacks, consumers remain open to trying new, value-driven products - Digital influence is critical
The impact of technology grows with income, but social media cuts across all levels
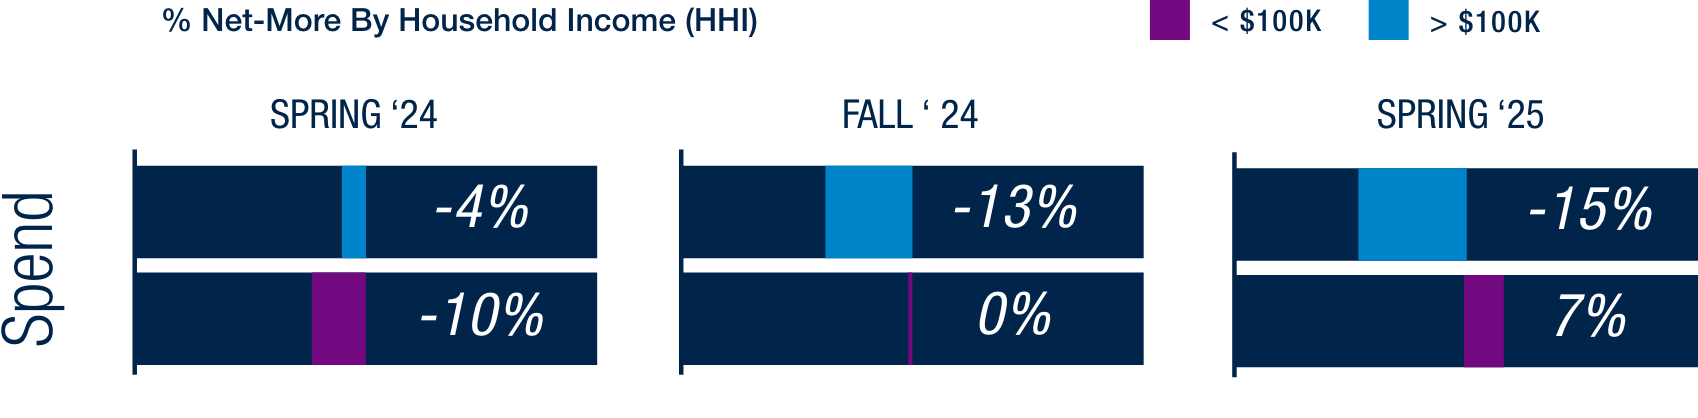
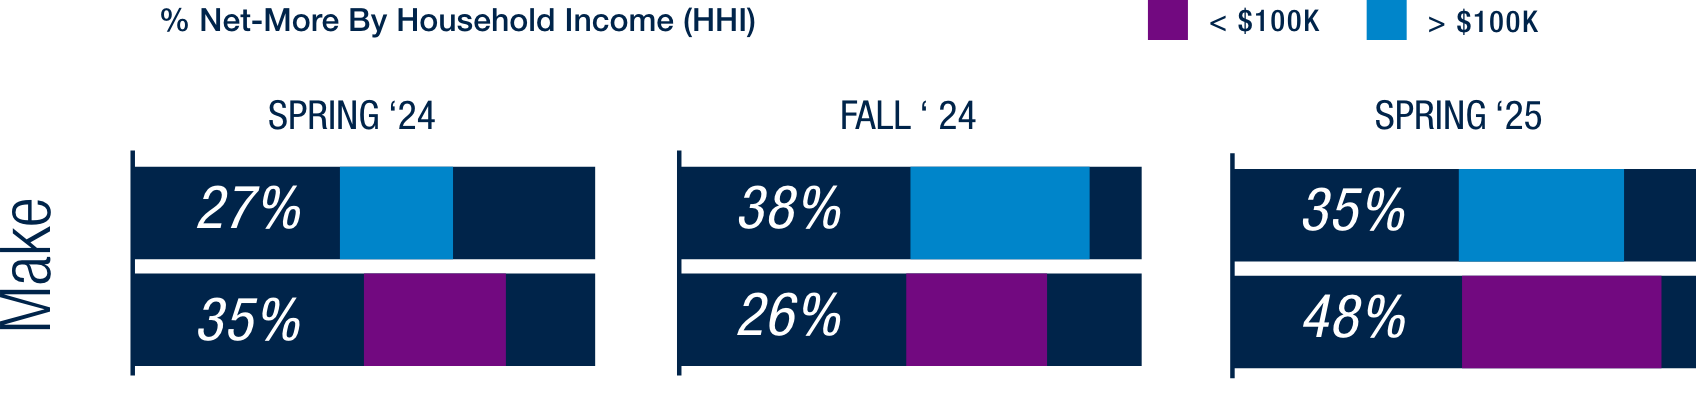
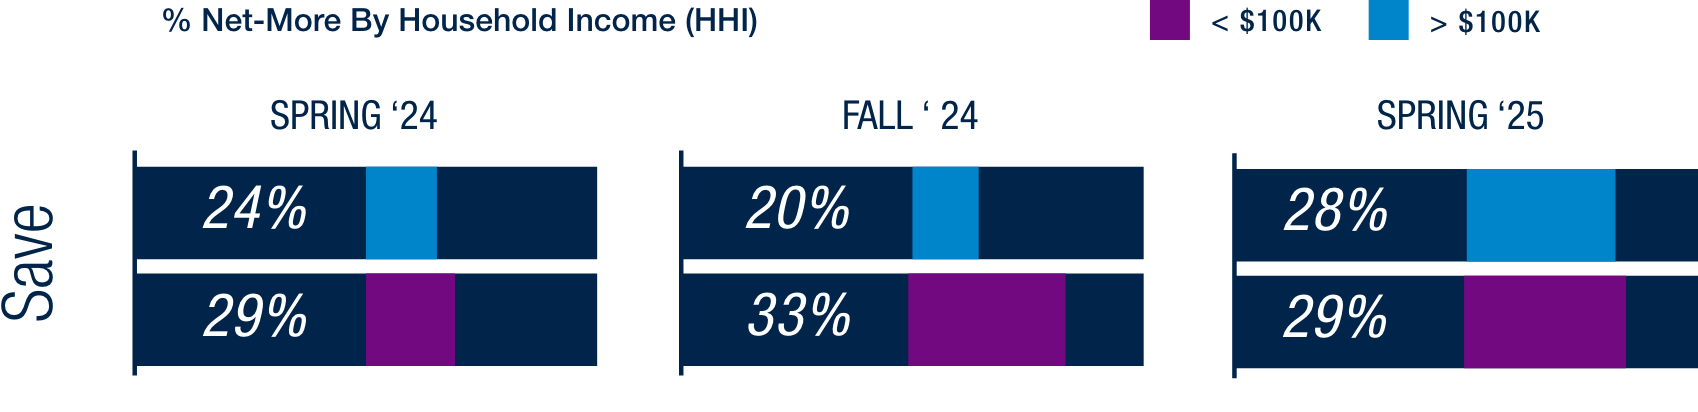
While all segments report net-positive expectations for earning and saving, planned spending diverges – medium-to-lower-income households (HHI <$100K) show a net-negative outlook, while higher-income households (HHI >$100K) remain net positive.
Compared to the Fall ‘24 survey, this divergence has become more pronounced. Higher income
households are increasingly optimistic, expecting to earn and spend more, while medium-to-lower-income households report declining confidence in both earning and spending, with a rising intent to save. These contrasting trends could impact economic momentum, with higher-income optimism supporting spending and medium-to-lower income caution signaling potential financial strain and softer demand.
Consumer Financial Plans for Next 6 Months
- SPEND
- MAKE
- SAVE
Category Spending Plans
Looking ahead to the next six months, consumers expect to cut back on spending overall, with the steepest pullbacks in dining and accessories. Compared to last fall, planned cuts have deepened even in essentials like groceries and personal care. Grocery spend is now at its lowest point in four cycles, suggesting consumers are no longer accepting price increases at face value – they are cutting volume and cost per unit, not shifting spend elsewhere but tightening across the board.
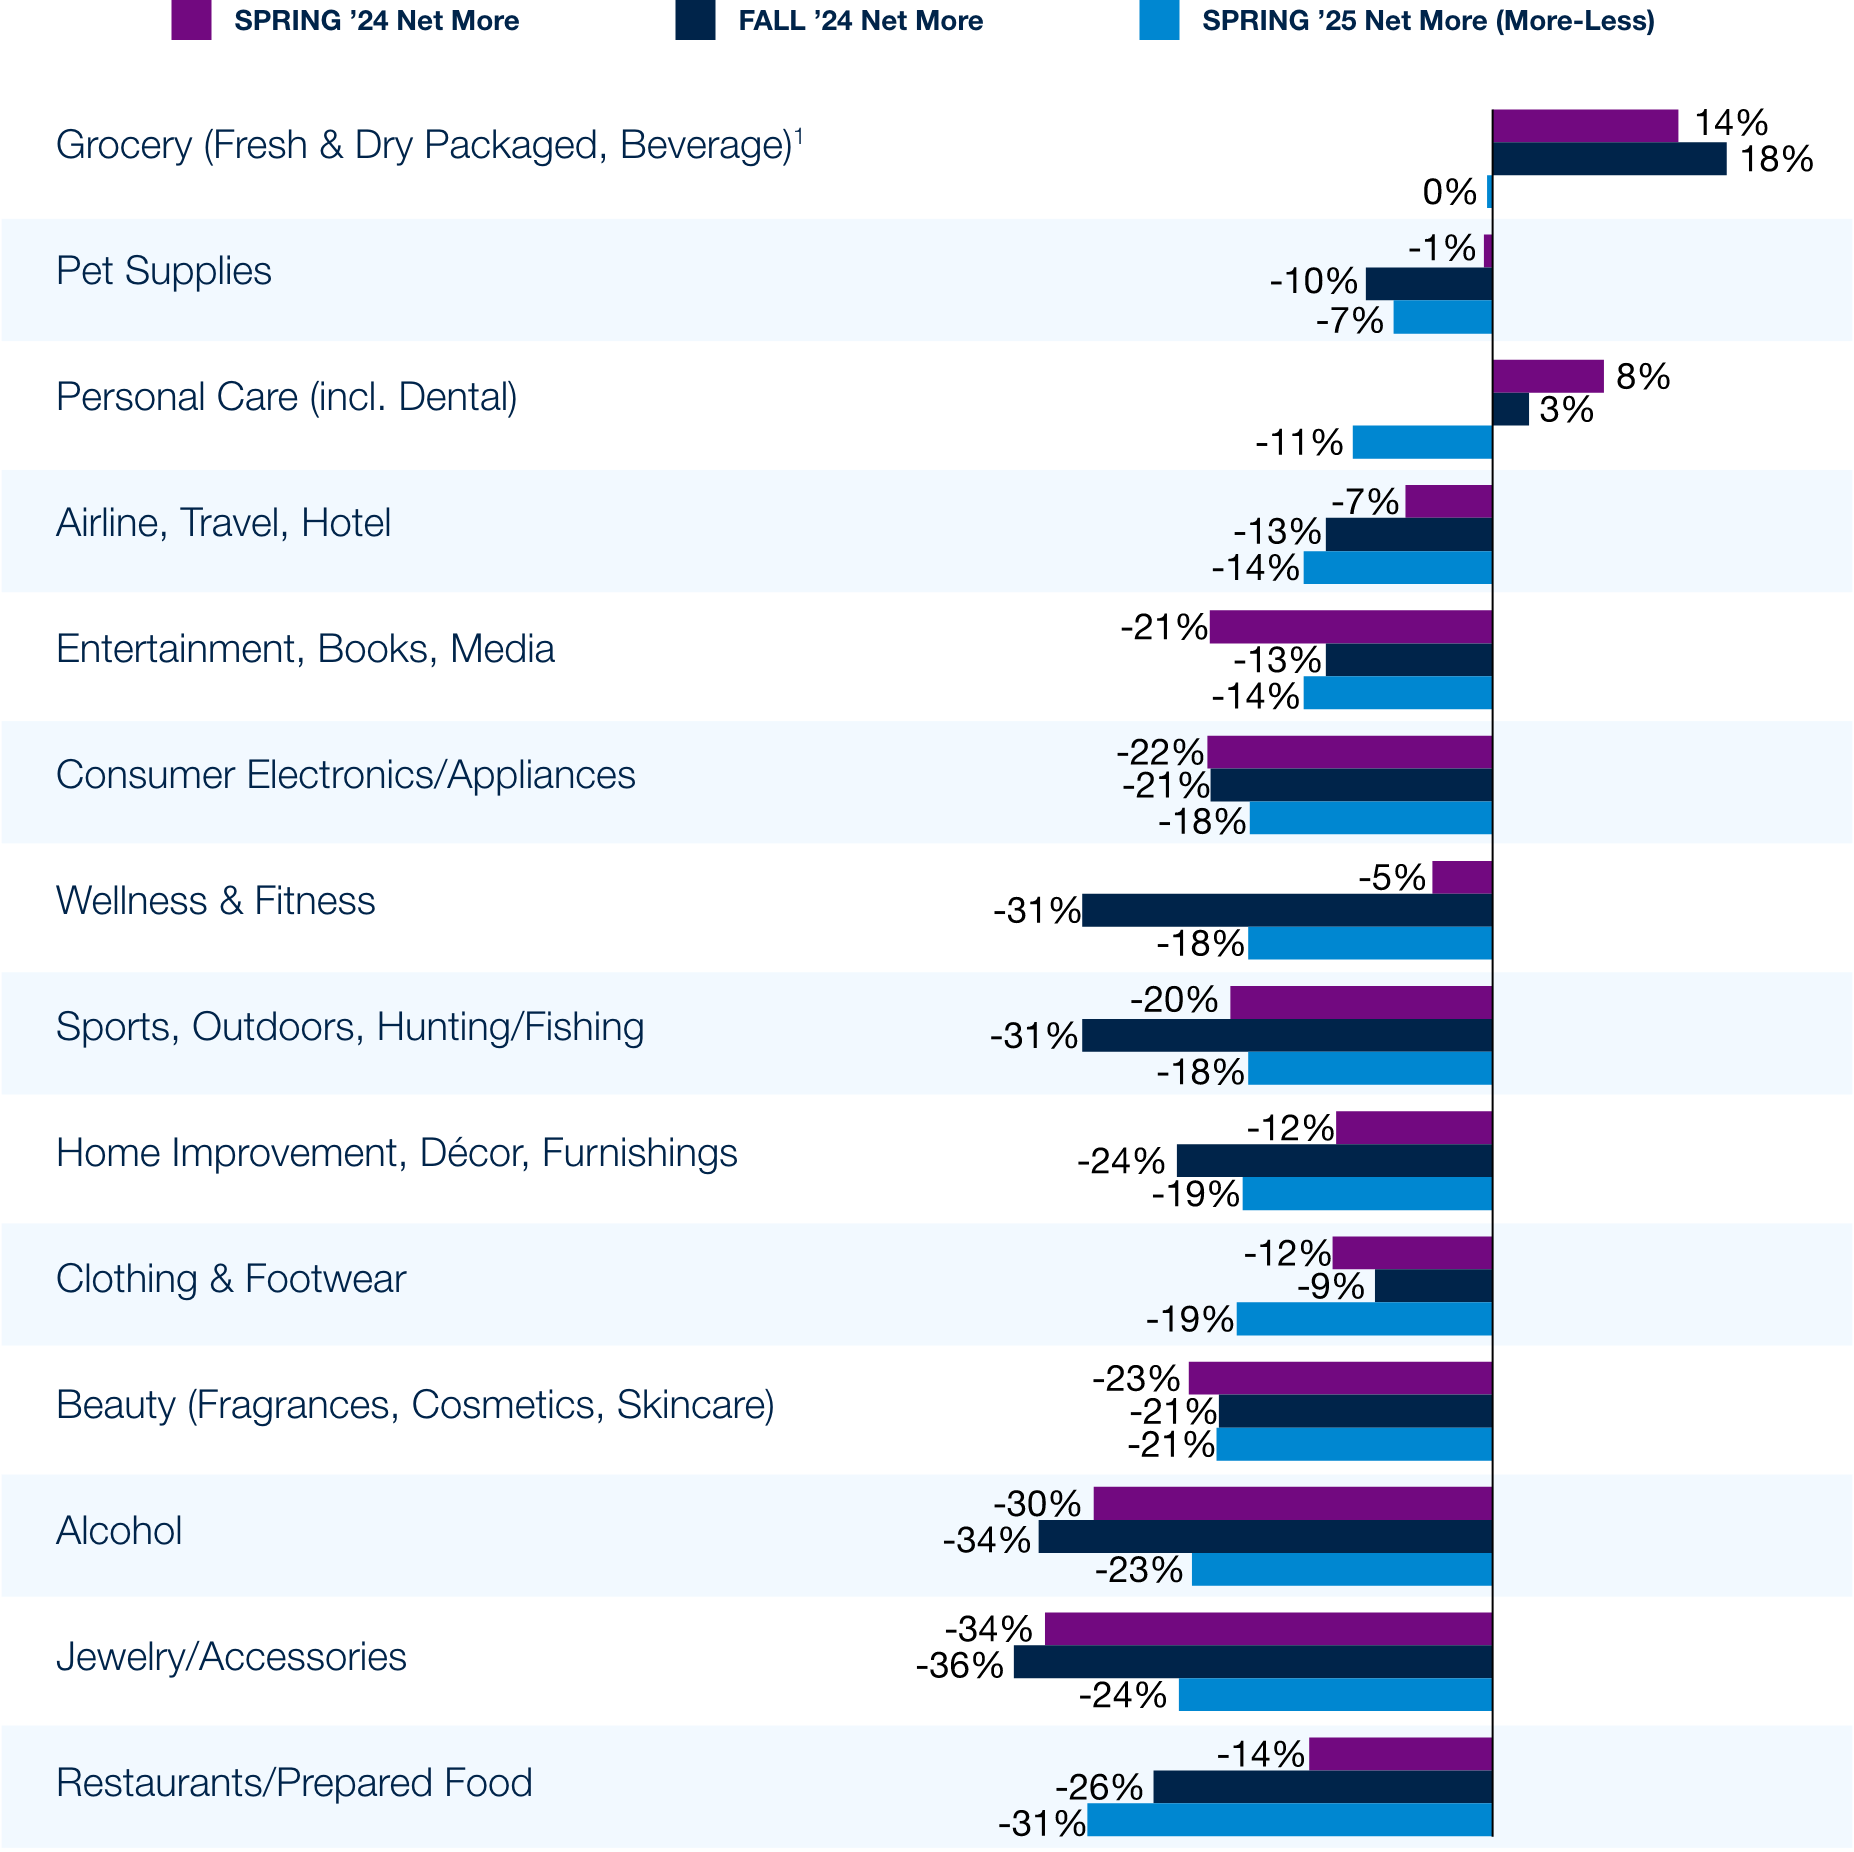
1Spring ’24 groceries data reflects the average of fresh food (30%) and dry packaged grocery / beverages (8%)
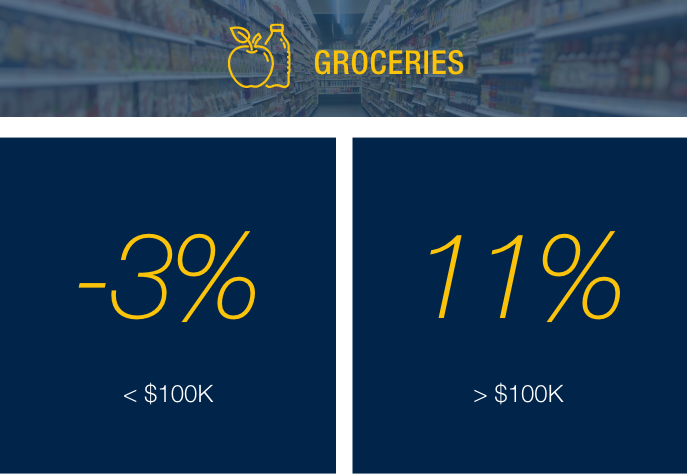
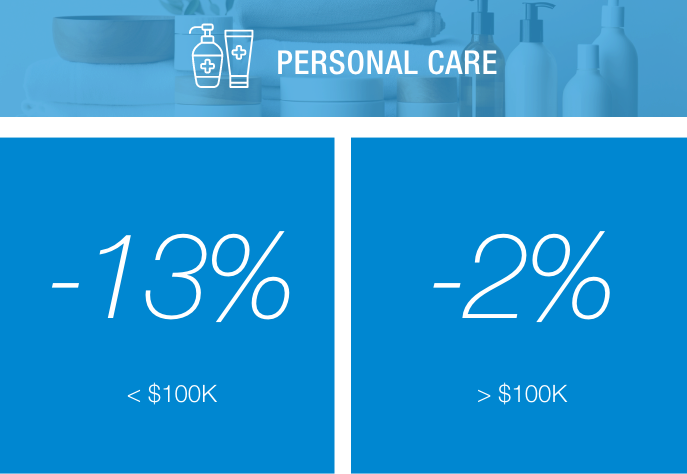
Inflation fatigue is hitting medium-to-lower-income households hardest, even in non-discretionary areas like groceries and personal care.
For groceries, there was a 14-point swing between higher- and medium-to-lower-income consumers: those earning more than $100K plan to spend a net 11% more, while those earning under $100K expect to spend 3% net less. A similar pattern appears in personal care, with an 11-point swing – higher-income consumers are holding steady at -2% net more, while lower-income consumers are pulling back significantly at -13%.
Plans to Spend Net-More by Income – Essential Categories

Beauty & Personal Care
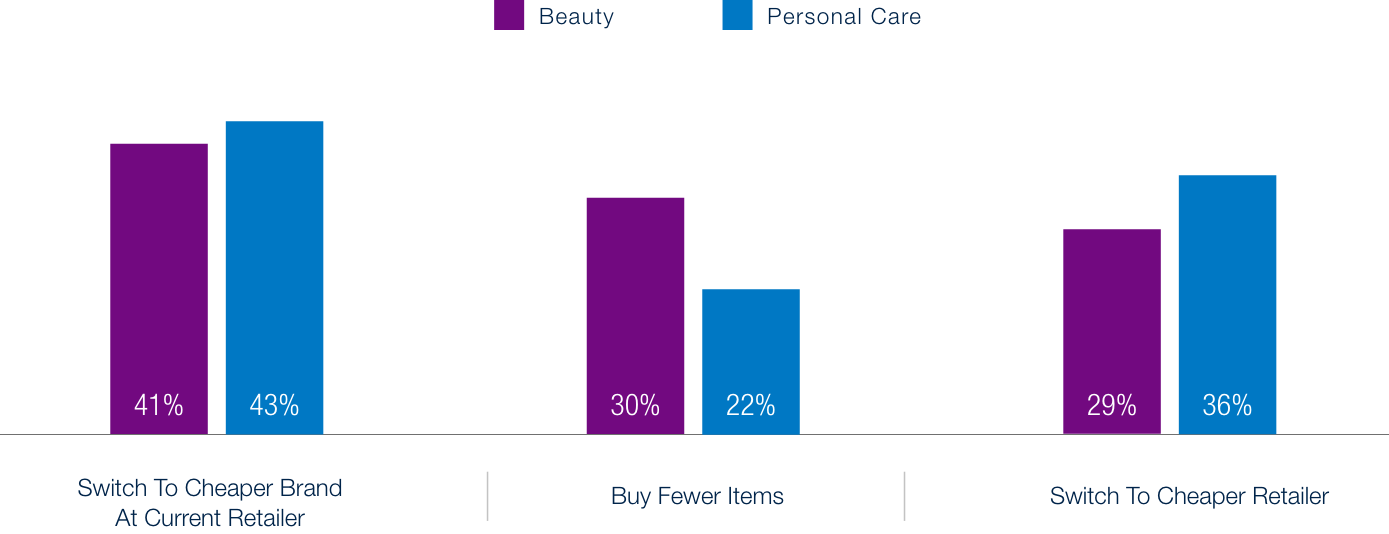
When it comes to beauty and personal care, brand loyalty remains low compared to retailer loyalty. Among cost-conscious consumers, more plan to switch to less expensive brands at their current retailer (41% for beauty, 43% for personal care) than to switch retailers for better prices (29% for beauty, 36% for personal care). This pattern is especially pronounced in beauty, where the gap between consumers’ willingness to switch to cheaper brands versus cheaper retailers is even wider. This highlights the need for retailers to invest in retention within a routine-driven, low-loyalty category.
Behaviors of Consumers Choosing Lower-Priced Alternatives
HHI Breakout of Switching Behavior
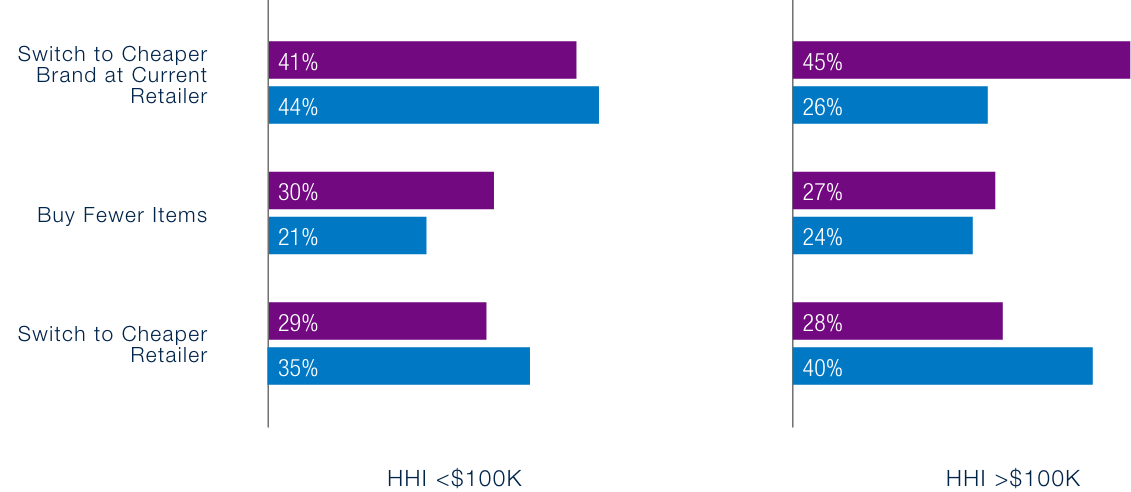
However, this trend does not hold across all groups. In personal care, higher-income shoppers (HHI >$100K) are more likely to switch retailers entirely in search of better prices (40%) than switch to cheaper brands at their current retailer (26%) – an exception to the broader trend. In beauty, brand-switching remains the primary cost-saving strategy across income levels.

Grocery
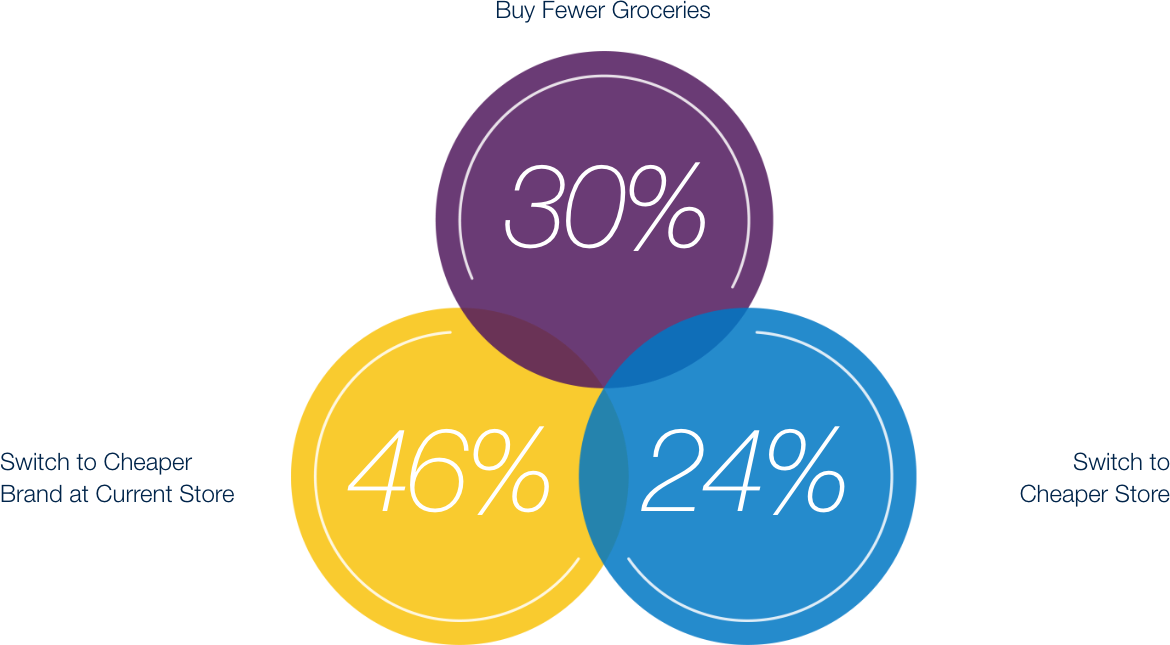
This trend extends to grocery shopping, where consumers show a strong preference for staying loyal to their current retailers rather than switching to lower-priced alternatives. Although overall grocery spending expectations remain flat this cycle (net-more = 0), 25% of consumers still plan to cut back. Nearly half (46%) of those say they’ll do so by choosing less expensive brands at the same store – indicating a shift in product preferences rather than shopping destinations. This points to rising interest in private-label or value-tier brands, as consumers prioritize affordability without disrupting established shopping routines.
Consumer Approach to Reducing Grocery Spend
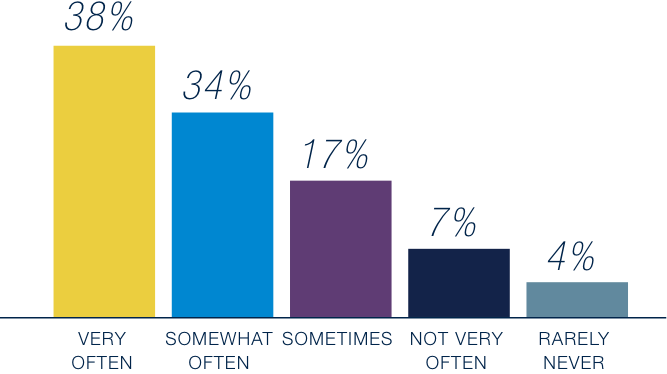
As consumers seek better value, they are increasingly embracing grocery store brands – private-label products that are exclusive to specific retailers, such as Great Value at Walmart or Kirkland Signature at Costco. In fact, 72% report purchasing store brand products somewhat to very often. This widespread adoption signals a significant shift – store brands are no longer seen merely as budget alternatives, but are becoming trusted, go-to options across a wide range of categories. As perceptions of value and quality evolve, retailers have a significant opportunity to strengthen loyalty and grow margins by investing in store brand innovation, marketing, and premiumization.
Frequency of Store Brand Purchases in Grocery
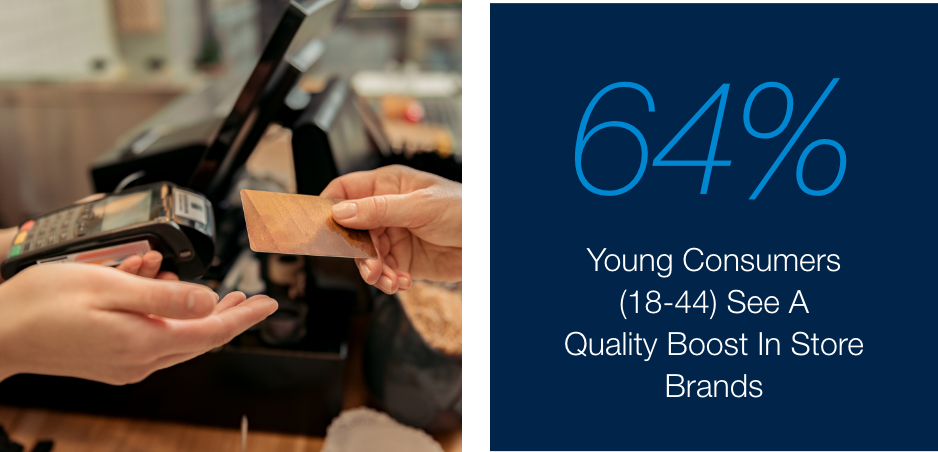
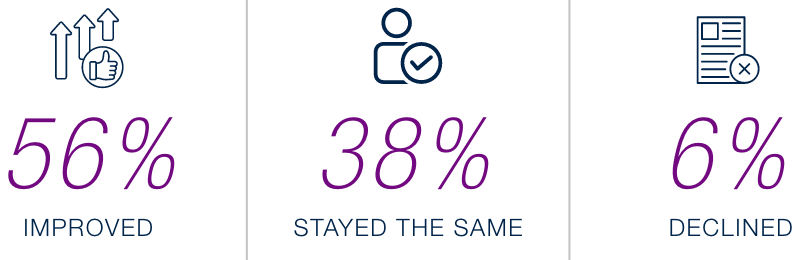
In fact, 56% of respondents believe the quality of store brand products has improved somewhat or significantly over the past year, while only 6% feel they’ve declined. Confidence in store brands is especially strong among younger shoppers: 64% of consumers aged 18-44 say store brand quality has improved, compared to 48% of those aged 45-80.
Consumer Perception of Store Brand vs National Brand Quality Over Past Year
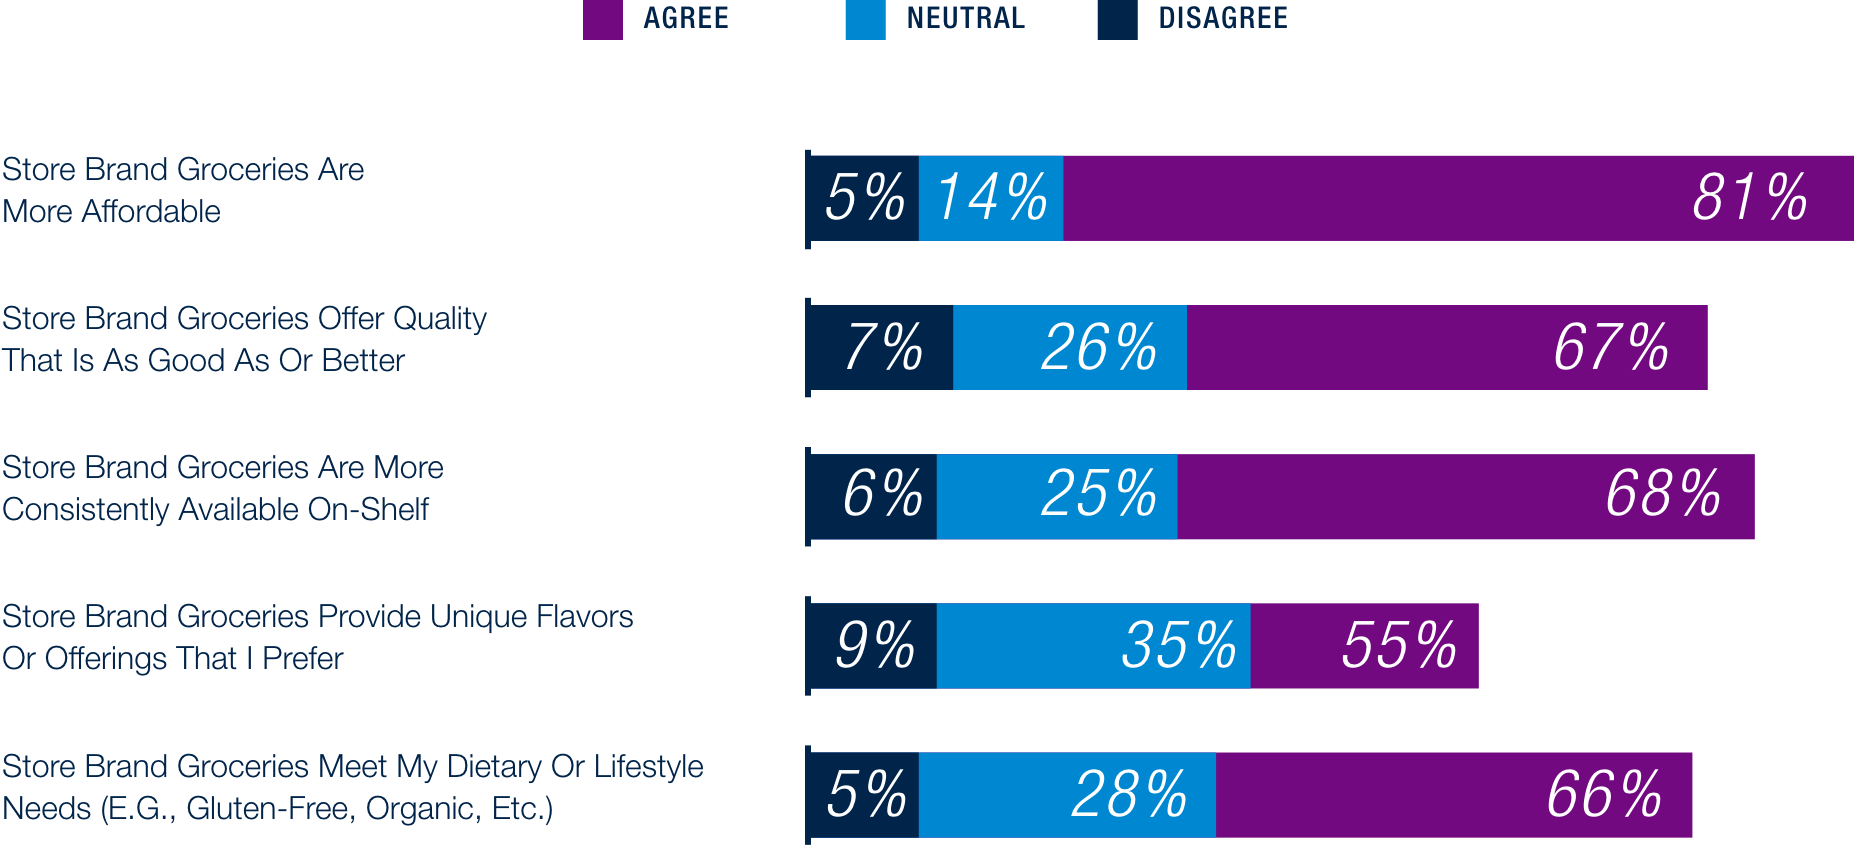
When comparing store brands to national brands, 67% of consumers say that store brands’ quality is just as good or better than national brands, and 55% appreciate the unique flavors offered – showing that value isn’t just about price but also includes quality and taste that meet or exceed expectations.
Consumer Perceptions of Store Brand vs
National Brand Groceries
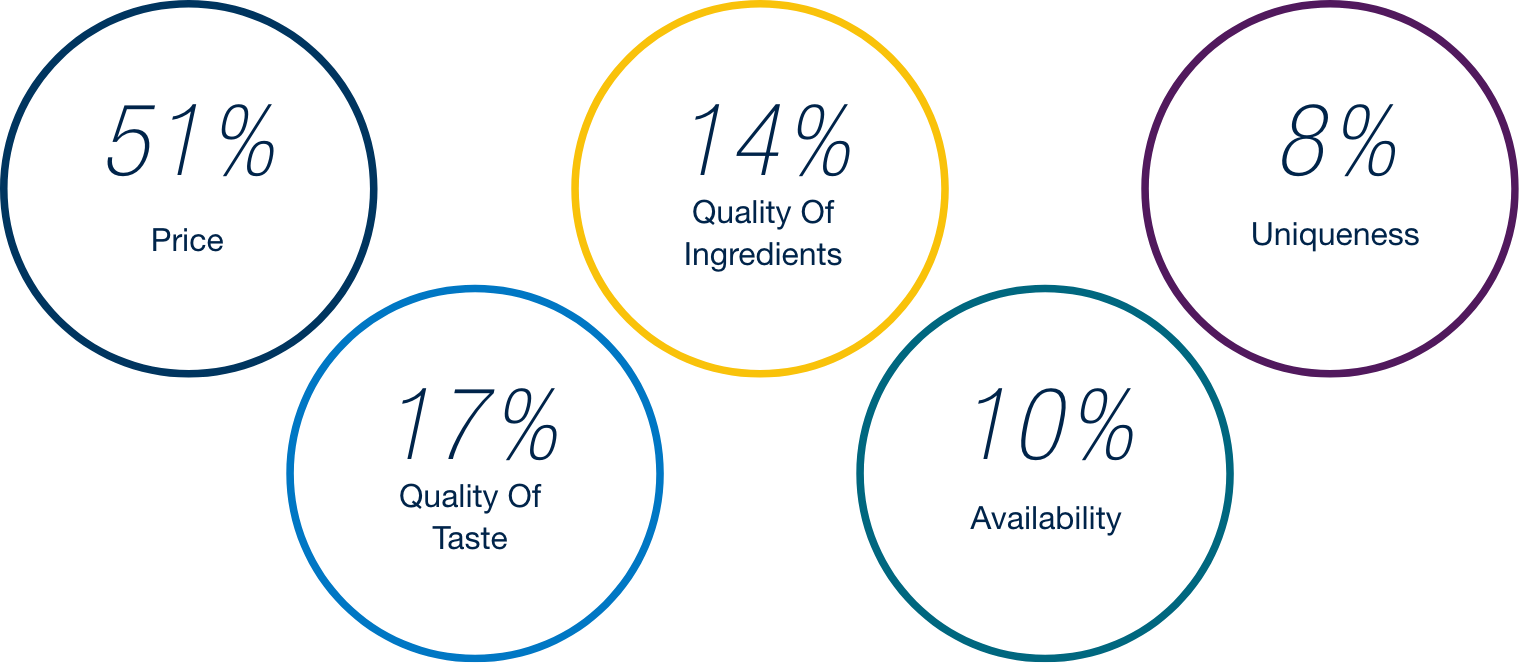
While it’s no surprise that price is the main driver of store brand grocery purchases – regardless of income – taste ranks second at 17%. This suggests shoppers increasingly view store brands not as a compromise, but as a smart choice offering both value and flavor, fueling continued private-label growth.
Top Reasons Consumers Choose Store Brand Groceries
Restaurants
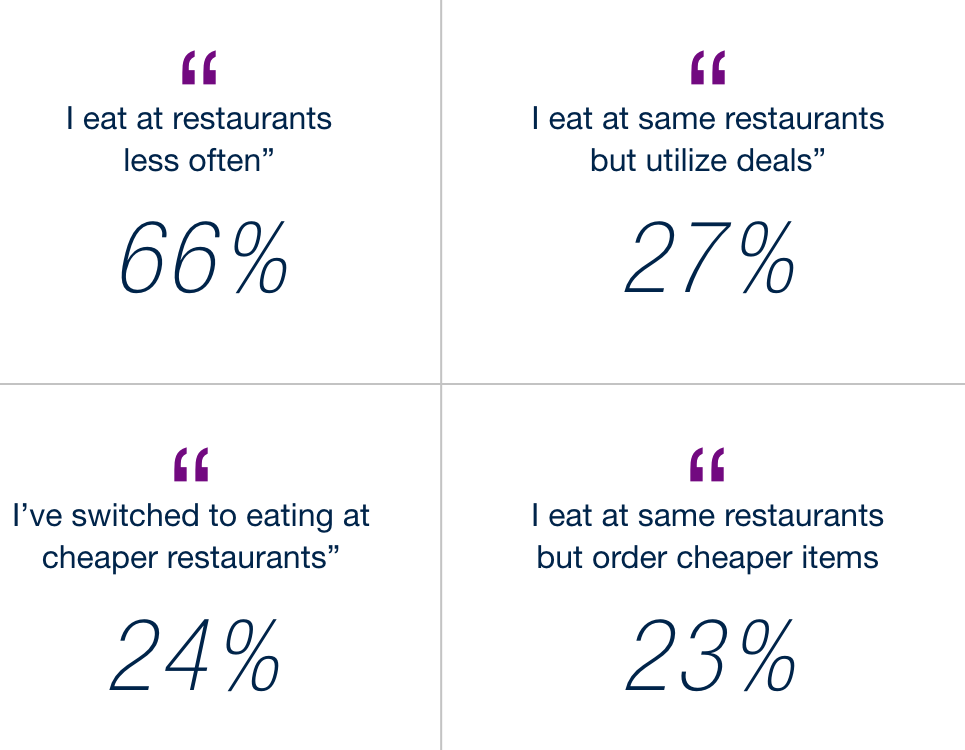
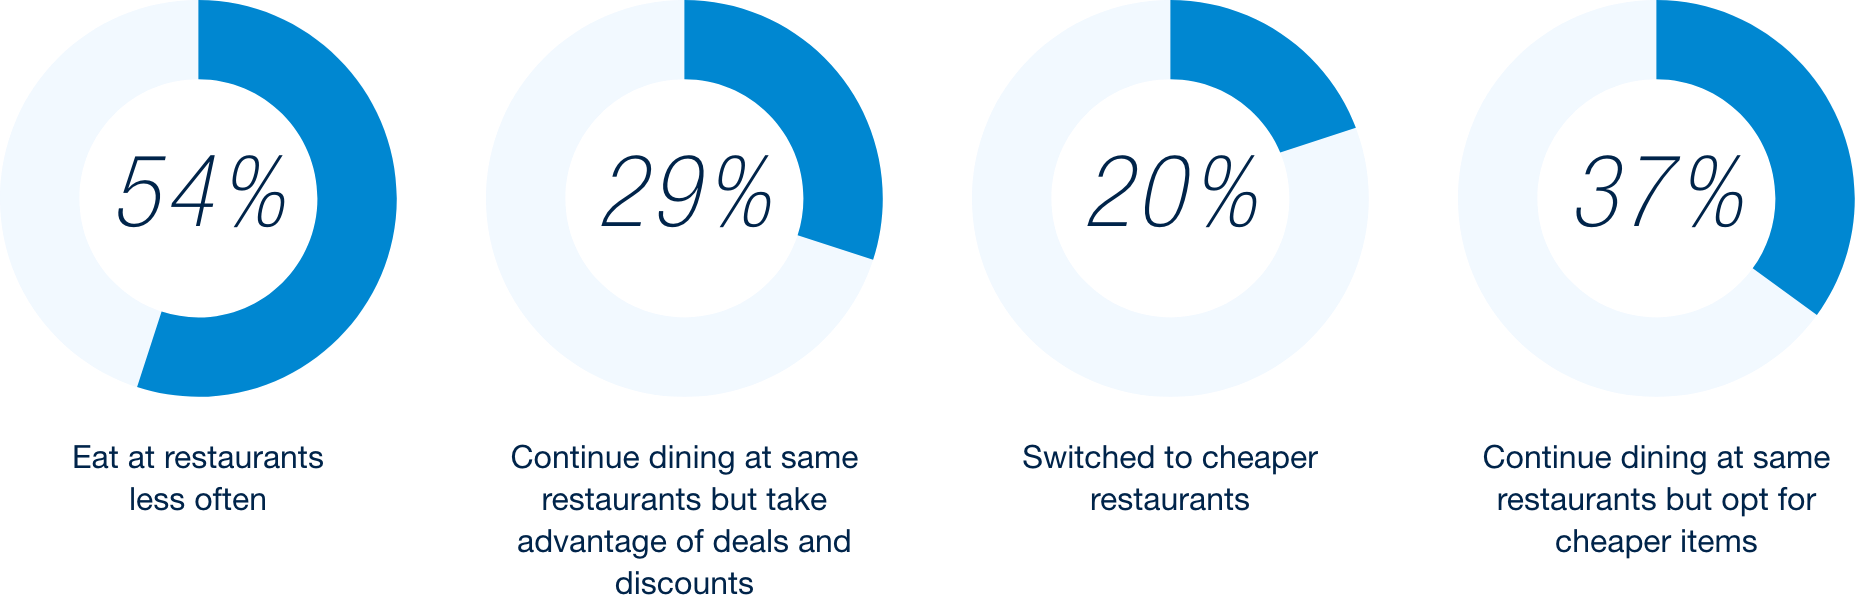
When it comes to restaurants, 66% of consumers are choosing to reduce how often they dine out, rather than seeking cheaper alternatives or switching locations. Among those cutting back, most are doing so by simply eating out less frequently, rather than adjusting their orders – only 23% report choosing cheaper items, and 27% say they use deals.

Ways Consumers are Reducing Restaurant Spending – Overall
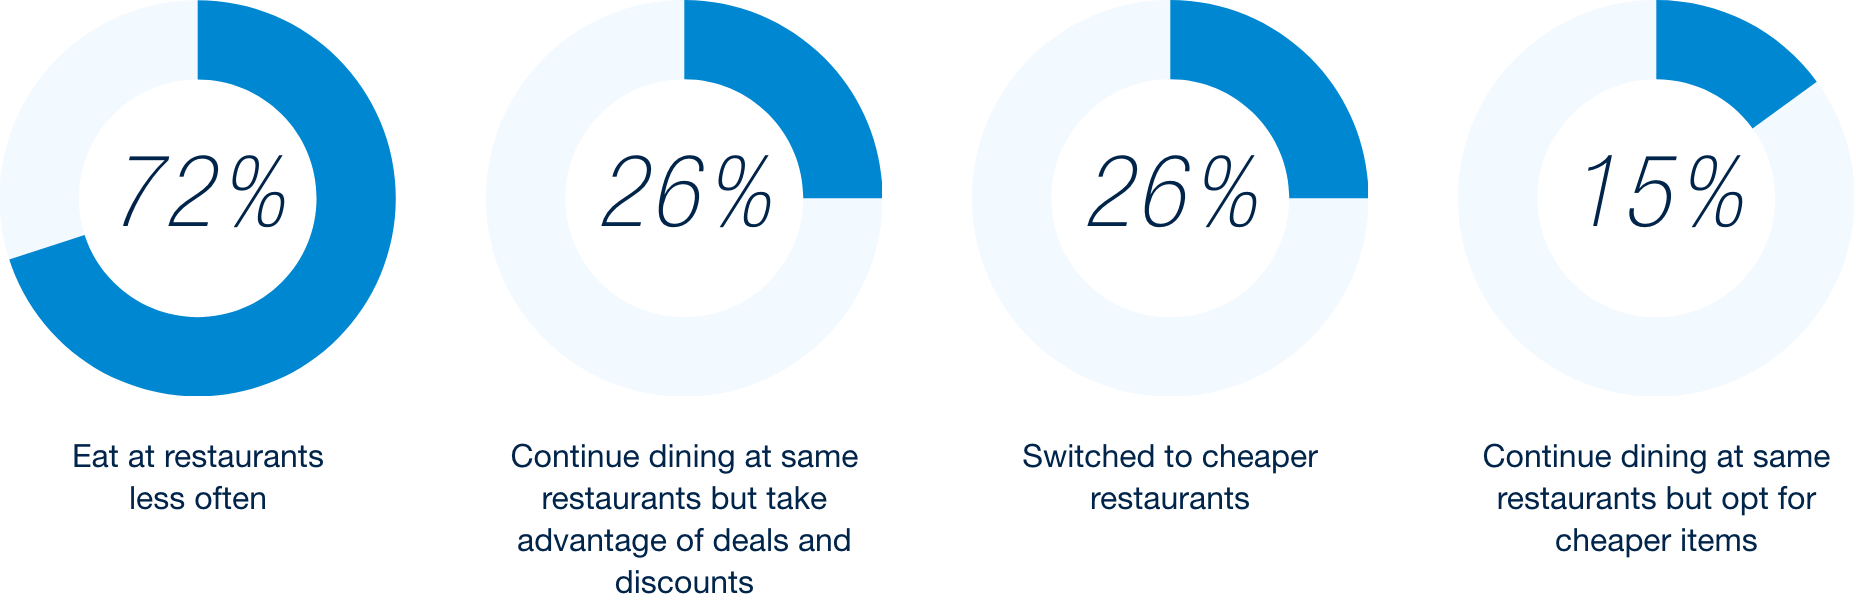
This suggests that consumers are prioritizing fewer dining occasions over compromising the experience when they do go out. Age also plays a role: younger consumers are more open to modifying their orders to save money, while older consumers (45-80) are more likely to scale back visits entirely.
Ways Consumers are Reducing Restaurant Spending by Age Group
- Ages 18-44
- Ages 45-80
Consumers remain open to new discoveries
Despite economic uncertainty, consumers remain open to trying new products across categories. In beauty, personal care, food & beverage, and restaurants, we continue to see interest in discovery of products and experiences.
Beauty & Personal Care
Beauty and personal care routines are central to consumers’ daily habits, influenced by age, income, and lifestyle. Within these routines, consumers have room to explore and adjust as they discover what works best for them. Overall, 79% of respondents follow a daily beauty routine, using items like makeup, anti-aging creams, and perfume. In comparison, personal care routines are more consistent, with 86% using daily wellness and hygiene products like shampoo, body wash, and deodorant.

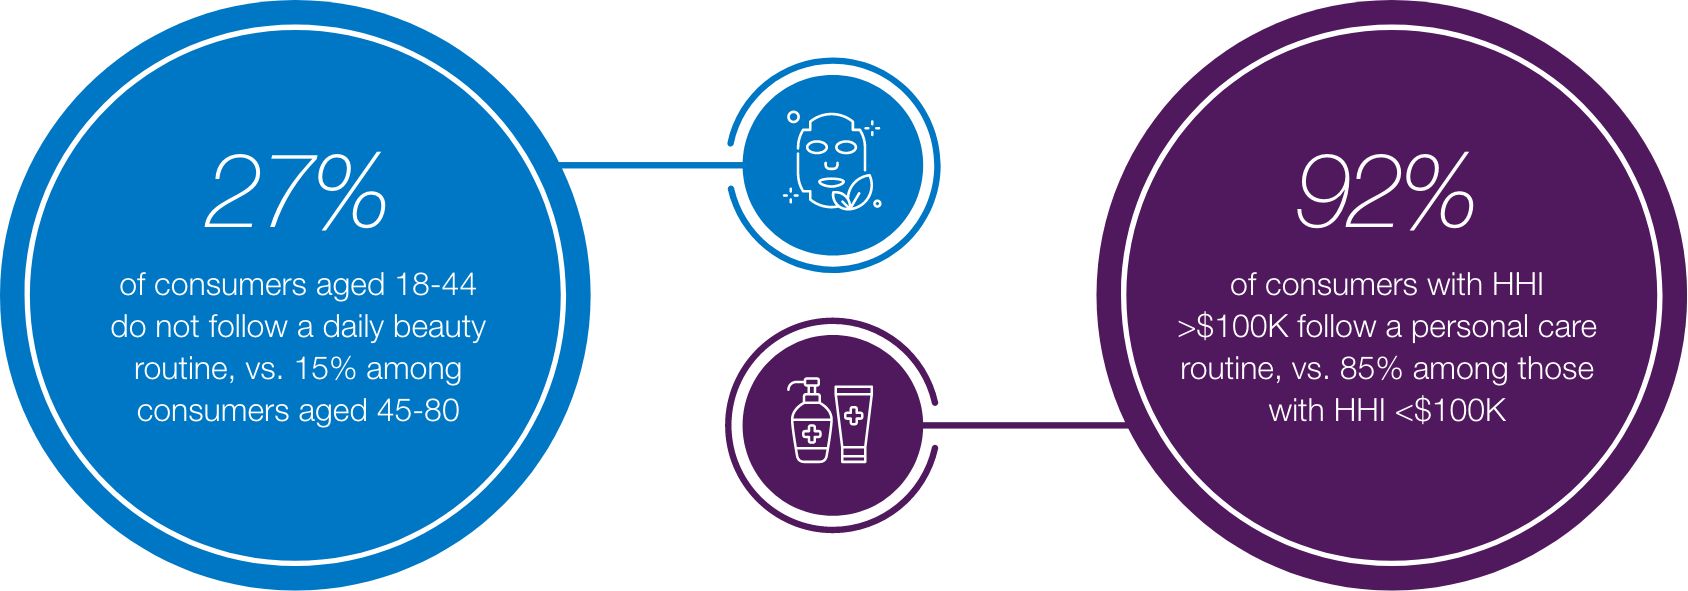
While personal care usage shows minimal variation across age groups, younger consumers (85% of those aged 18–44) are more likely than older ones (73% of ages 45-80) to follow a beauty routine.
Income also plays a role in routine adherence: 87% of higher-income respondents (HHI >$100K) report following a beauty routine, compared to 77% of those earning <$100K. A similar pattern appears in personal care, with 92% of higher-income respondents adhering to a set regimen, versus 85% among those with incomes <$100K. These routines suggest ongoing opportunities for trial, with consumers potentially open to new brands or products that align with their evolving preferences.
Daily Routine Consistency Among Consumers
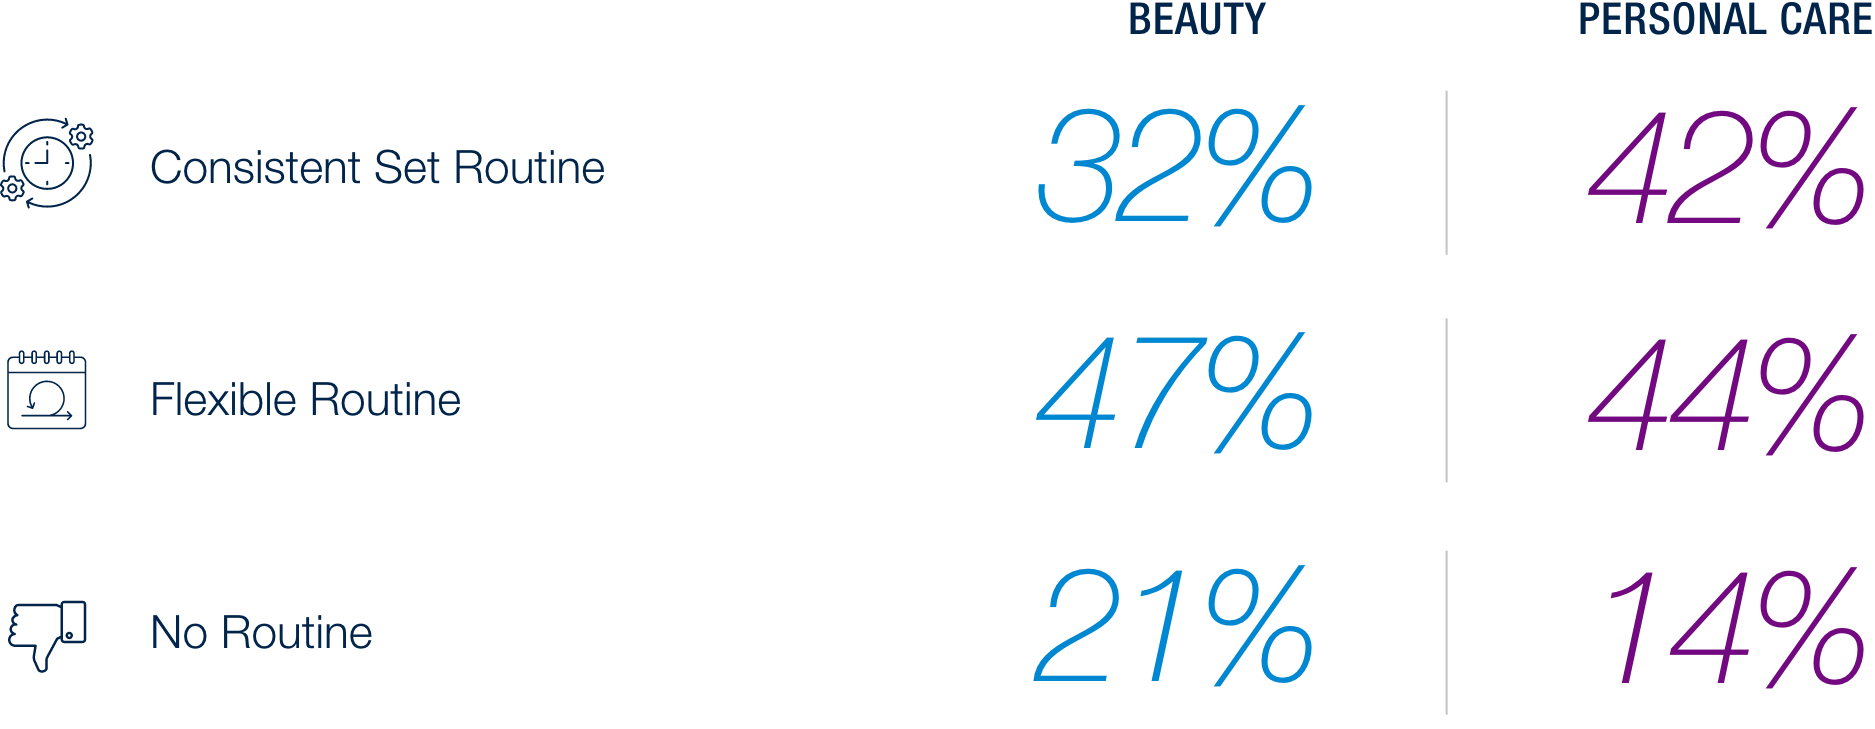
Even among consumers with routines, retailer strategies should differ. Those with rigid habits are typically in maintenance mode and respond best to loyalty incentives, refills, or bundling. More flexible consumers are open to adjustments but need low-friction trial options, like samples or minis, and a clear value to justify switching.
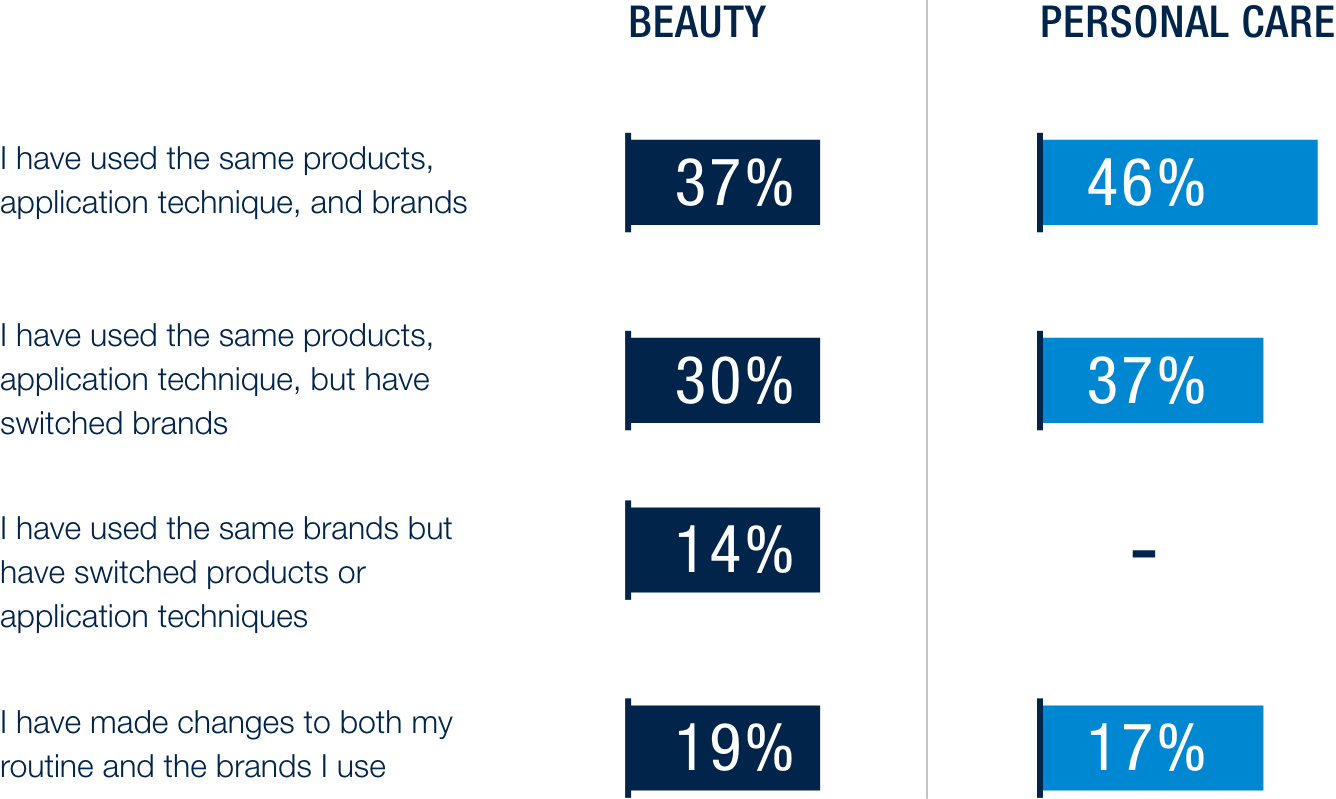
More than half of consumers in personal care are actively making changes to their brands and/or routines, reflecting a willingness to adjust to new options. Similarly, 63% of beauty consumers are modifying their brands, products, or application techniques, indicating a higher level of experimentation and flexibility in their beauty routines.
How Beauty / Personal Care Routines have Evolved over the Last Year
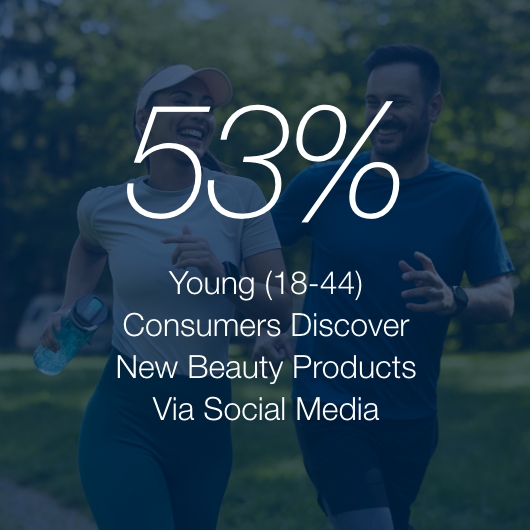
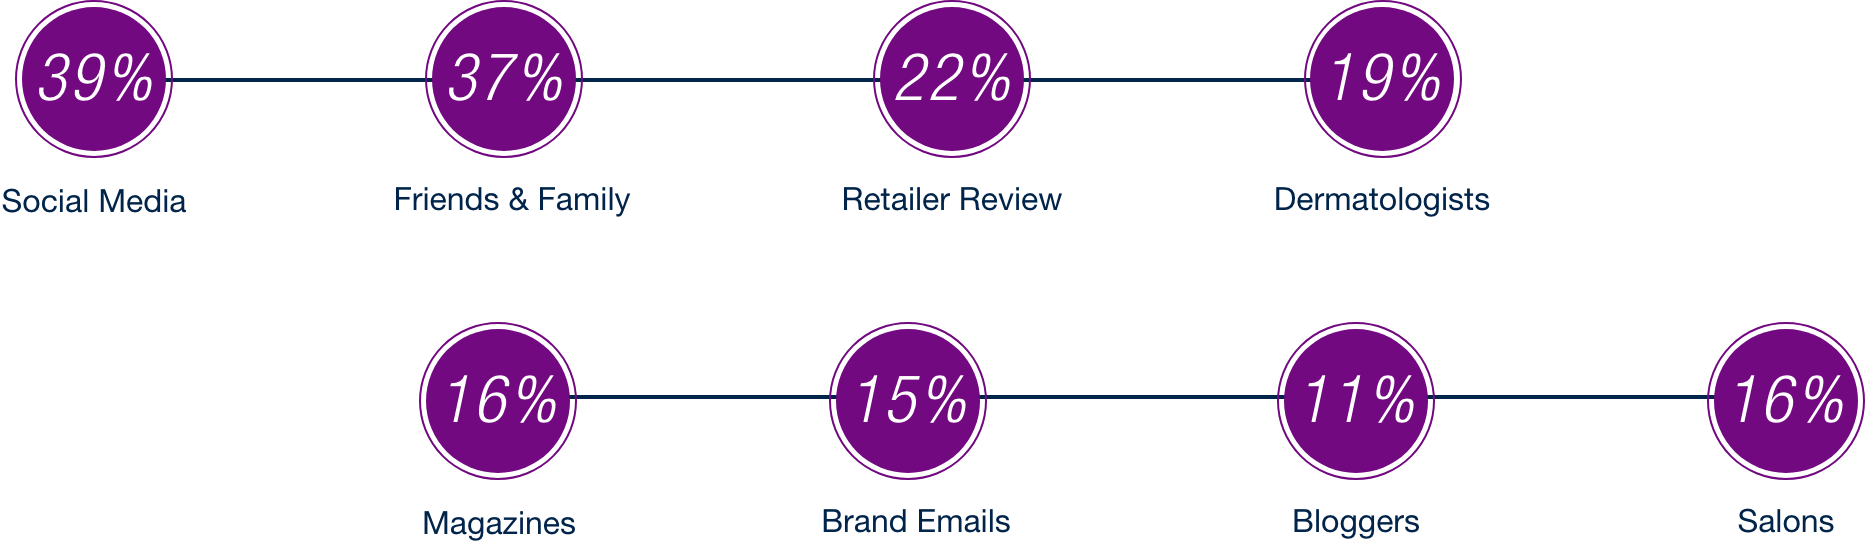
Social media has become the leading driver of product discovery and purchase in both beauty and personal care. Nearly half of respondents discover products through social platforms (45% for beauty, 49% for personal care), outpacing word-of-mouth from friends and family (36% for beauty, 37% for personal care). The influence is even stronger among younger consumers aged 18–44, with 53% (beauty) and 49% (personal care) relying on social media for new finds. These insights highlight the critical importance of robust, targeted digital engagement strategies across social channels.
Top Channels for Product Discovery
- Beauty
- Personal Care
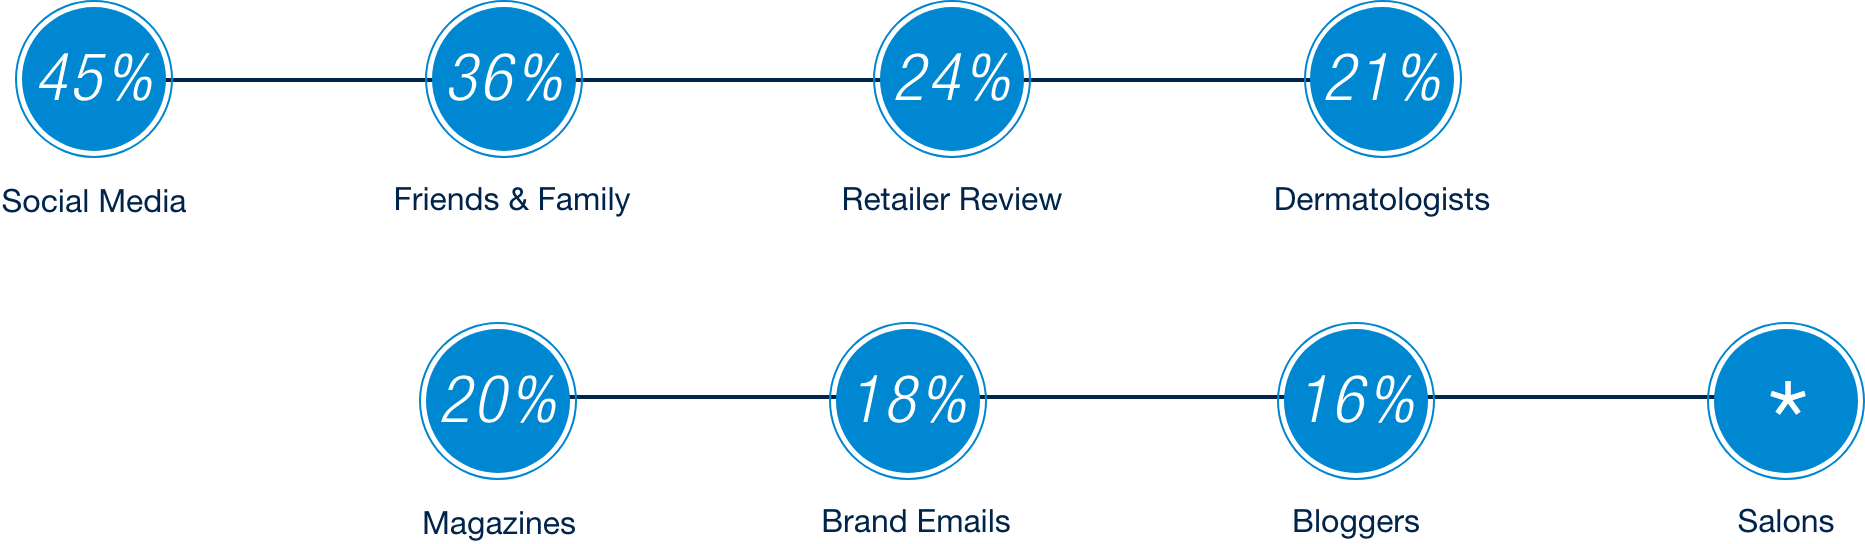
*Salons not included as a response option for the beauty category

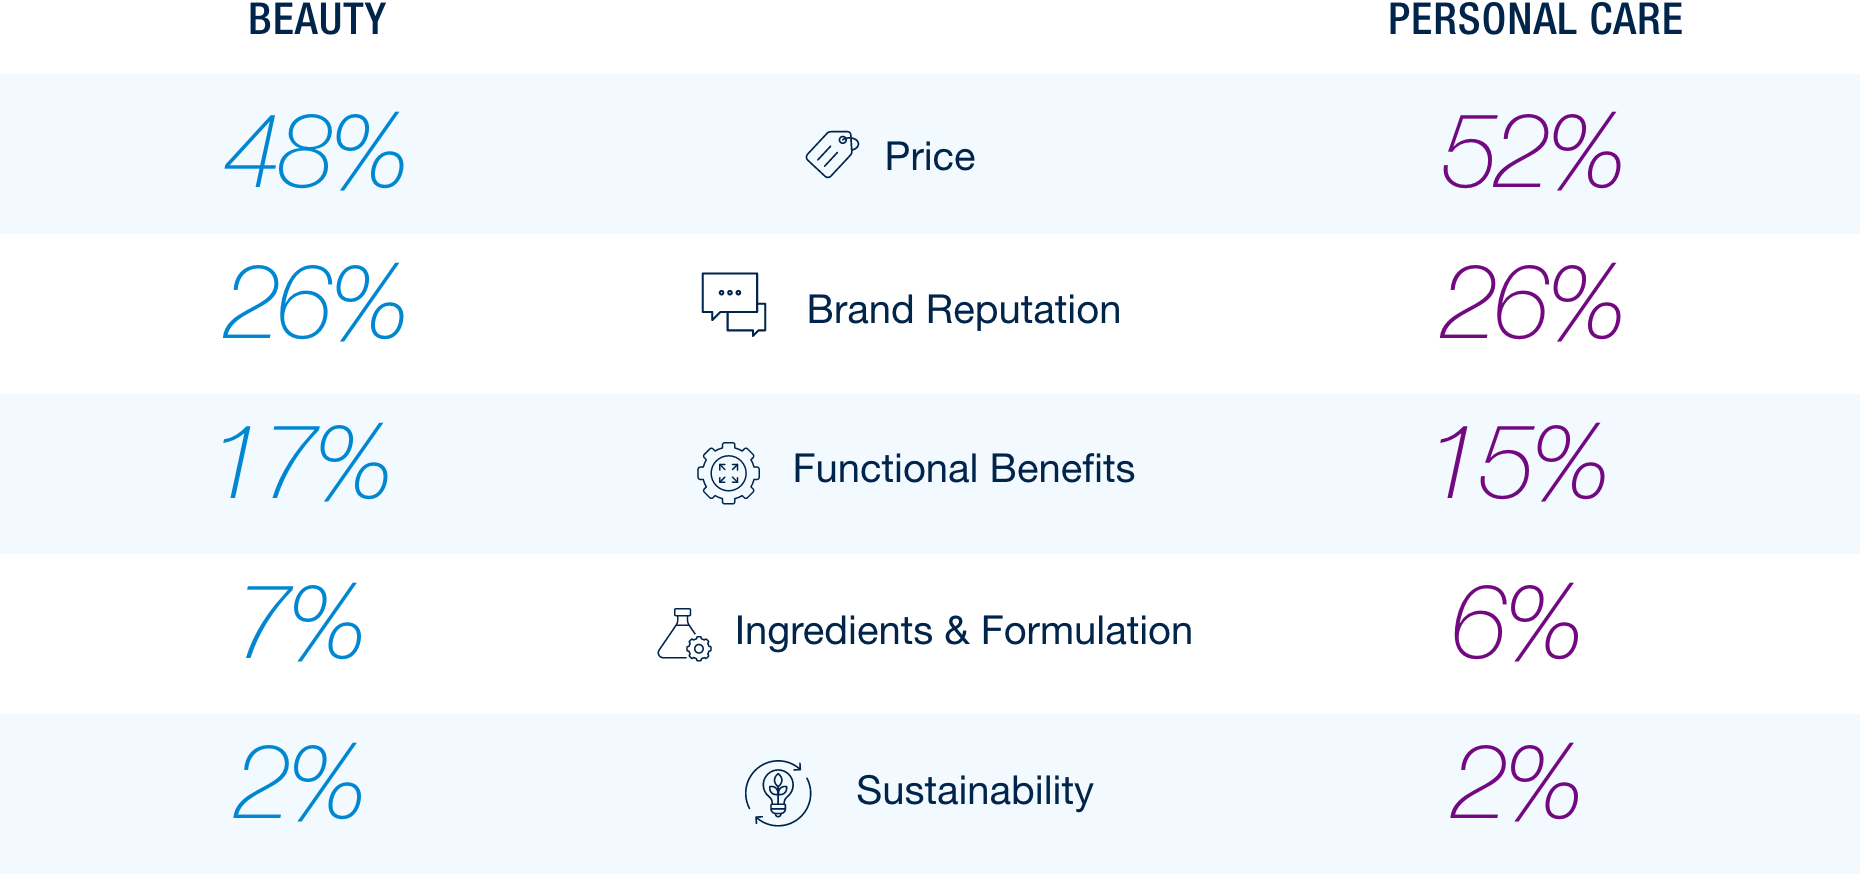
When trying a new brand, consumers across all income levels prioritize price and affordability, with 48% citing it as the top deciding factor for beauty products and 52% for personal care. Brand reputation and trust follow, with 26% considering it a key factor, even though previous findings show stronger loyalty to retailers than individual brands. Sustainability ranks lowest, with over 60% identifying it as the least important consideration when trying a new brand. These insights suggest that, when exploring new options, consumers are more influenced by cost, convenience, and trust in the overall brand experience than by ethical or environmental factors.
Top-Ranked Purchase Drivers for New Brands

Food & Beverages
As consumers seek value in the grocery aisle, their openness to store brands reflects a broader willingness to explore alternatives. This trend extends into the food and beverage space, where brand experimentation is equally evident, driven not just by price but also priorities like health and wellness.
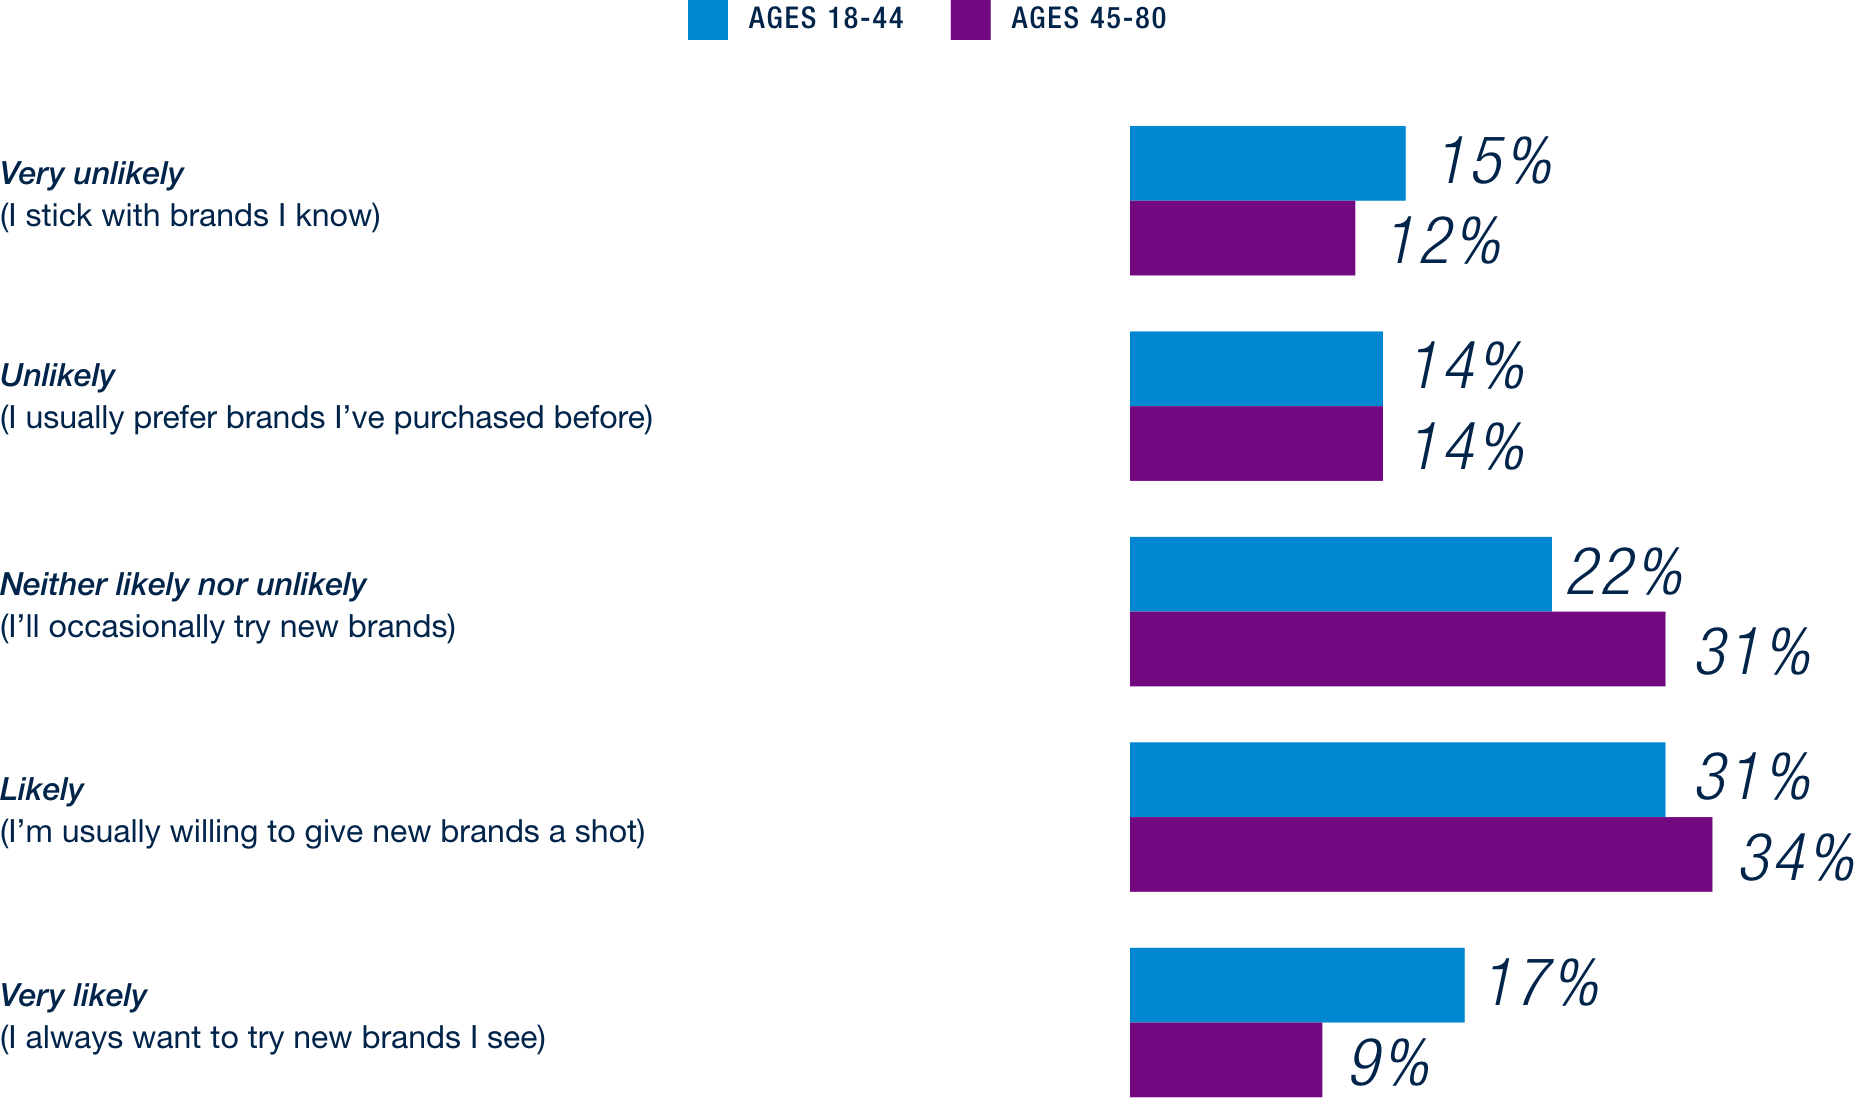
In this category, consumers show a willingness to explore new brands, with 73% indicating they at least occasionally try new options. Interestingly, older respondents are slightly more open to brand exploration than younger ones – 75% of those aged 45–80 reported a willingness to at least occasionally try new brands, compared to 71% of respondents aged 18–44.
Consumer Likelihood to Purchase New Food & Beverage Brands by Age Group
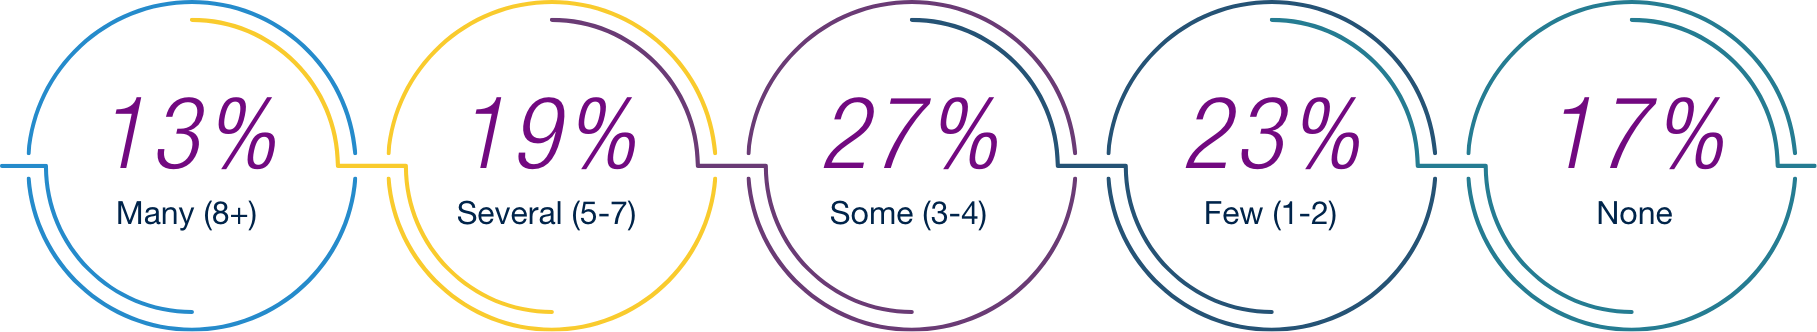
Building on this, 82% of consumers have tried at least one new food or beverage brand in the past six months, further underscoring the broad range of options consumers are willing to consider.
Number of Brand Switches in Food & Beverage Over Last 6 Months
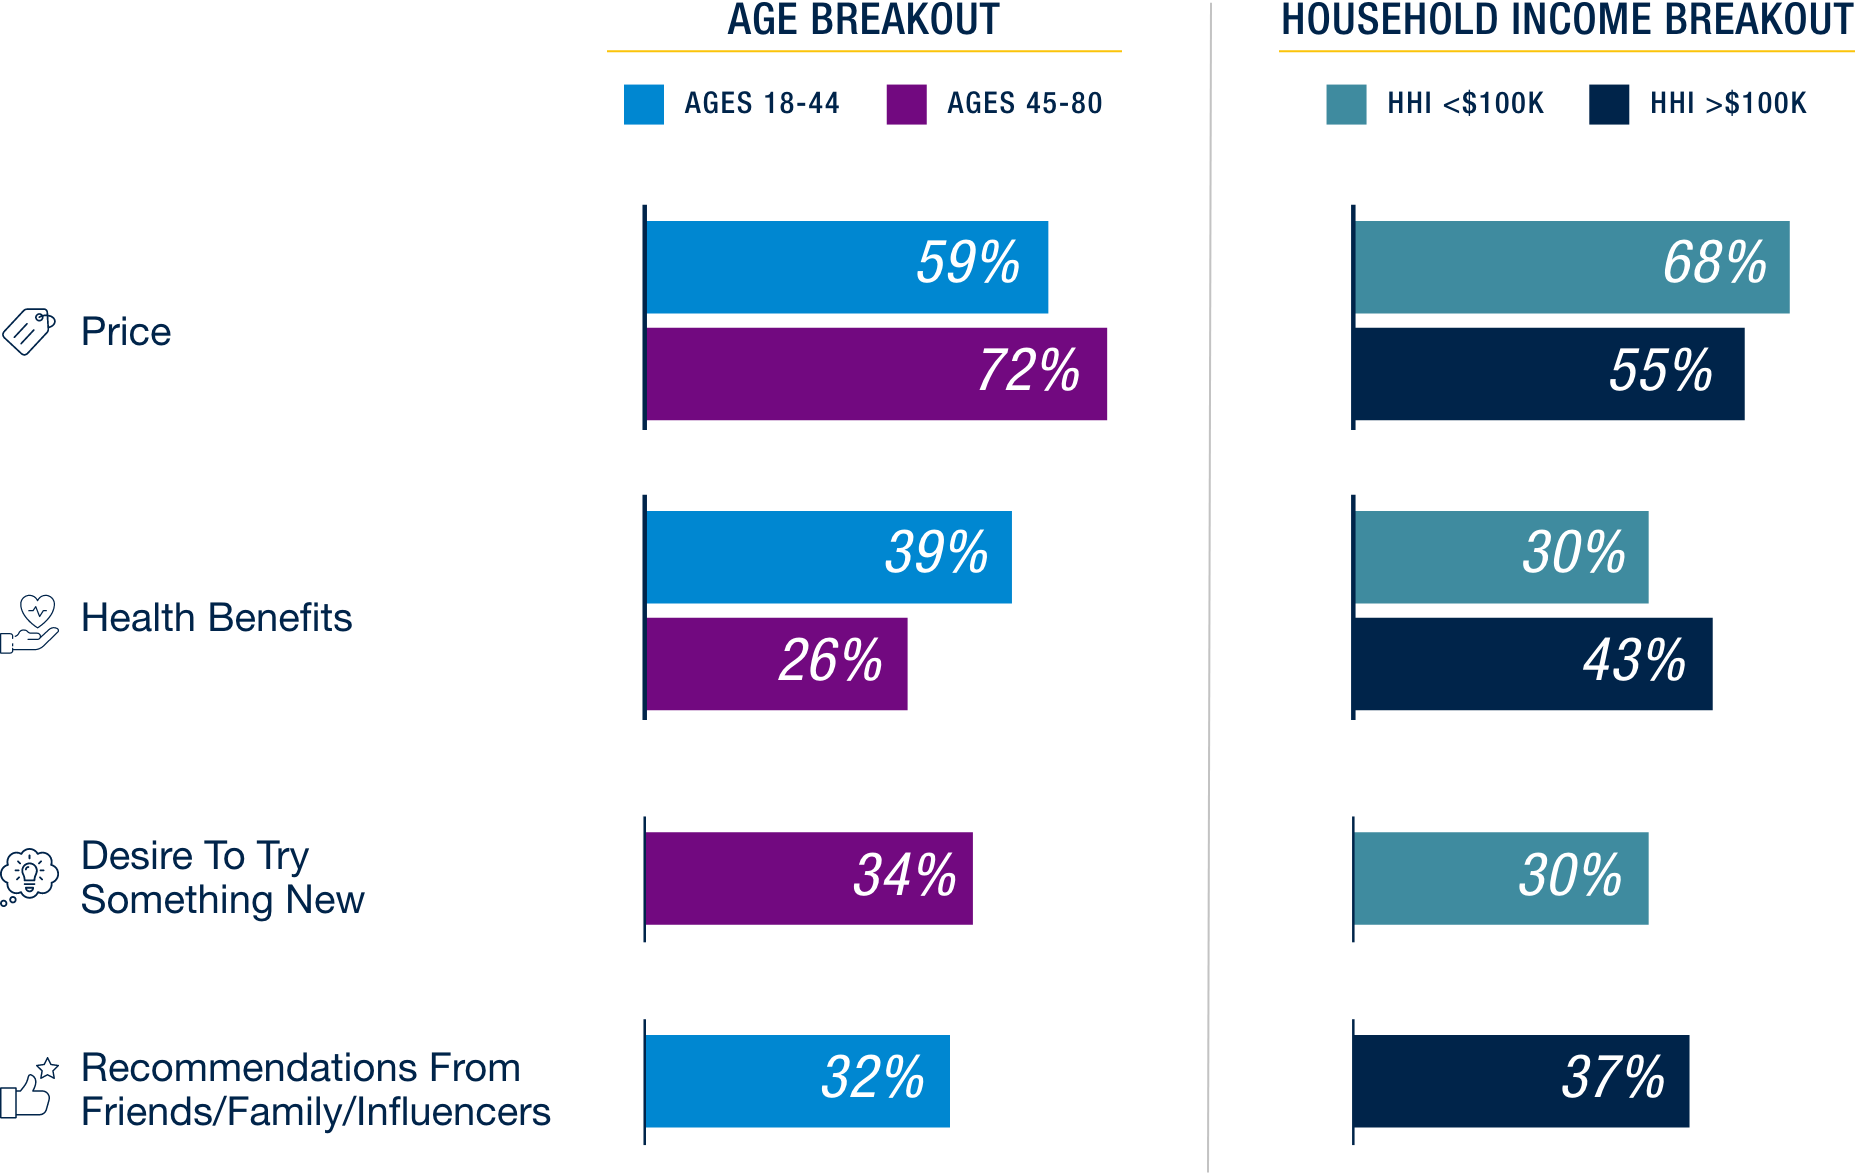
When asked about their reasons for switching food and beverage brands, consumers cited various motivations, with price emerging as the most significant factor overall, cutting across all age groups and income levels. For younger consumers (18-44) and those with higher household incomes (>$100k), health considerations were the second most important driver. In contrast, for older consumers (45-80) and those from medium-tolower-income households (<$100k), the desire to try something new ranked second.
Top Reasons Consumers Switch Food & Beverage Brands
In an open-ended question asking consumers to name the most recent brand they tried, Poppi emerged as a top response. The brand, known for its functional soda offerings and gut health benefits, appears to be gaining traction with health-conscious consumers. Its high recall in this context suggests strong momentum and growing awareness, particularly among younger demographics who are increasingly prioritizing wellness in their purchasing decisions.

RESTAURANTS
Consumer switching behavior is also evident in restaurant food and beverage purchases. This cycle, we looked at how often consumers buy full meals, takeaway meals/snacks, and prepared drinks from restaurants.
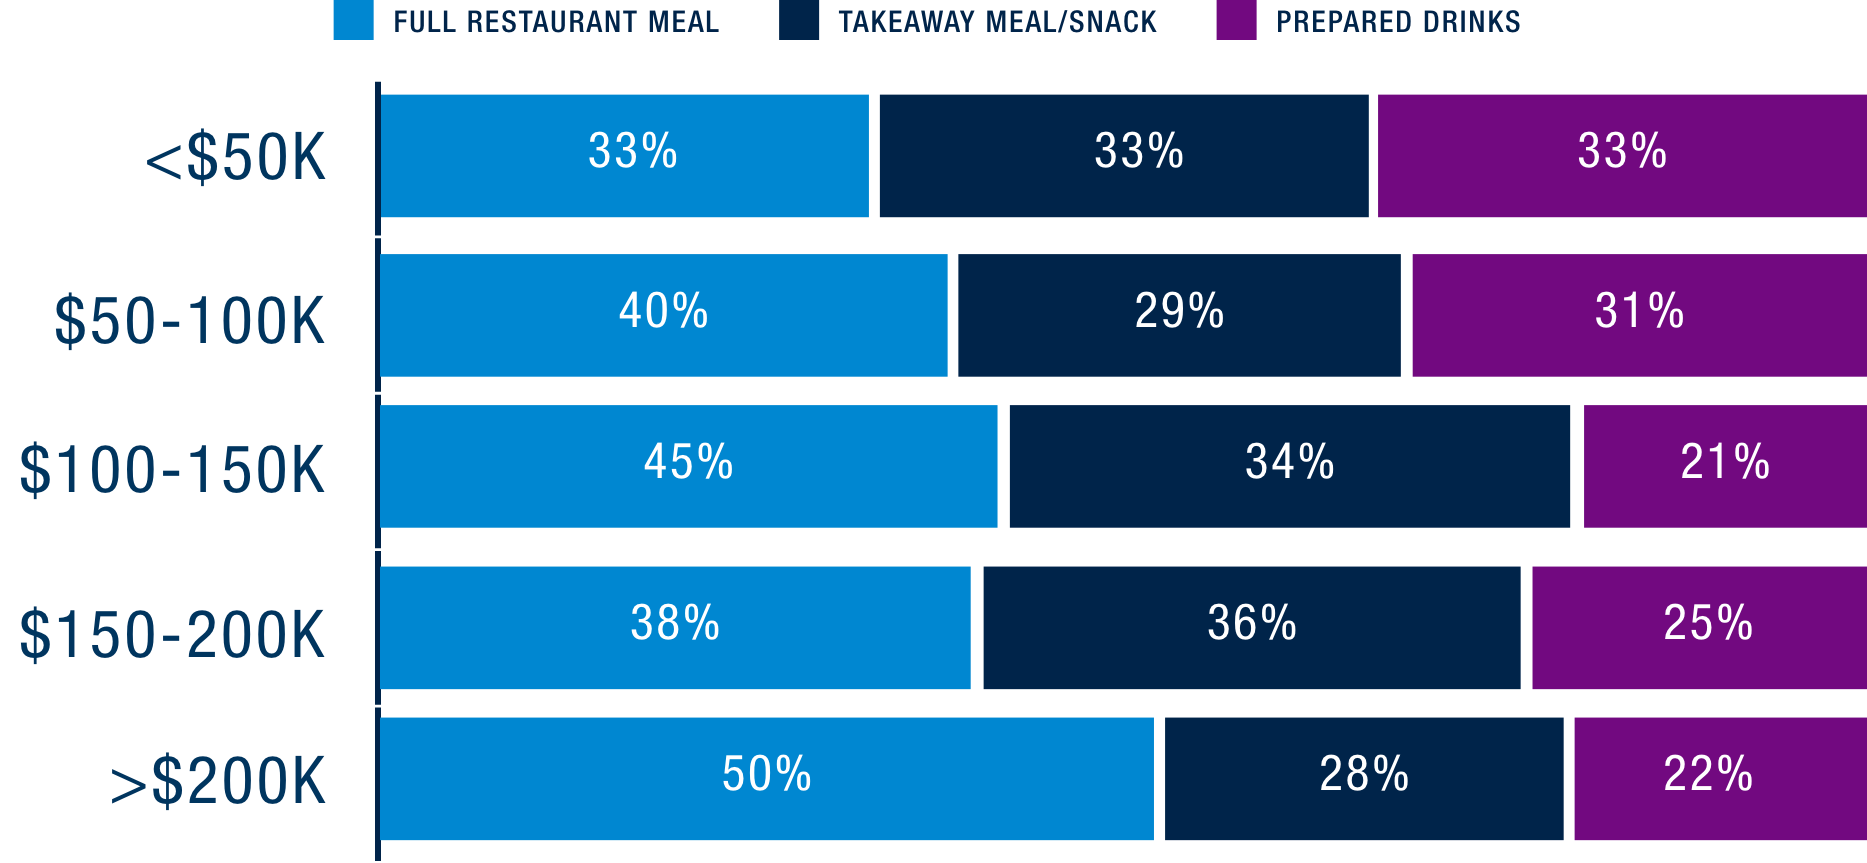
As income rises, dining out becomes more common: 45% of respondents with HHI over $100K rank full restaurant meals as their most frequent purchase, compared to 36% of those with HHI under $100K. Among high-income consumers aged 45–80, that number rises to 51%, pointing to a strong preference for convenience and dining experiences. While restaurant dining is down overall, 24% of consumers say they plan to switch to lower-priced restaurants – potentially driving more demand for takeaway meals and snacks.
Most Frequently Purchased Food & Beverage by HHI
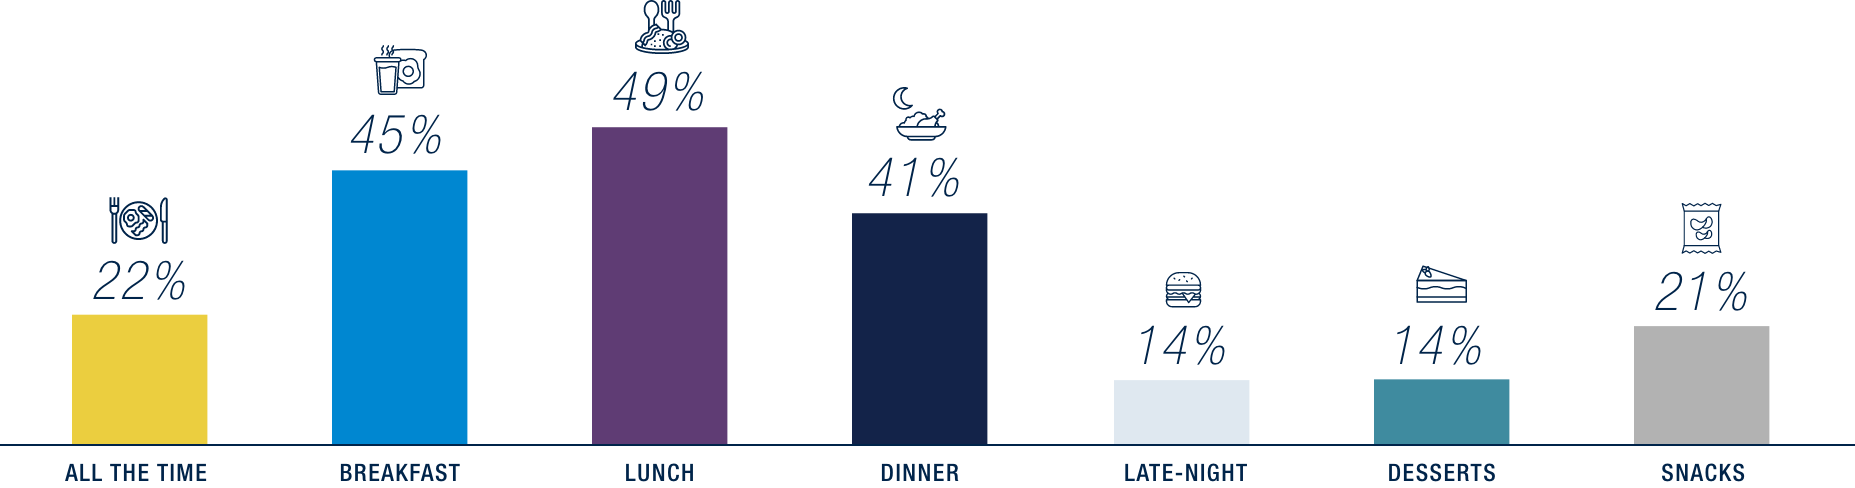
In addition to adjusting where they dine, consumers also show a willingness to experiment with new flavors during different meal occasions. Among consumers who chose new and innovative flavors as a top reason for purchasing a freshly prepared meal or snack, lunch stands out as the most popular time to experiment with new tastes, with 49% of consumers trying something different during this meal. There was a notable 13% difference between younger and older consumers for late-night occasions, and a 20% gap for dessert, with younger consumers being more likely to experiment with new foods during these times.
When Consumers are Open to New Foods or Flavors
Driving long-term customer loyalty
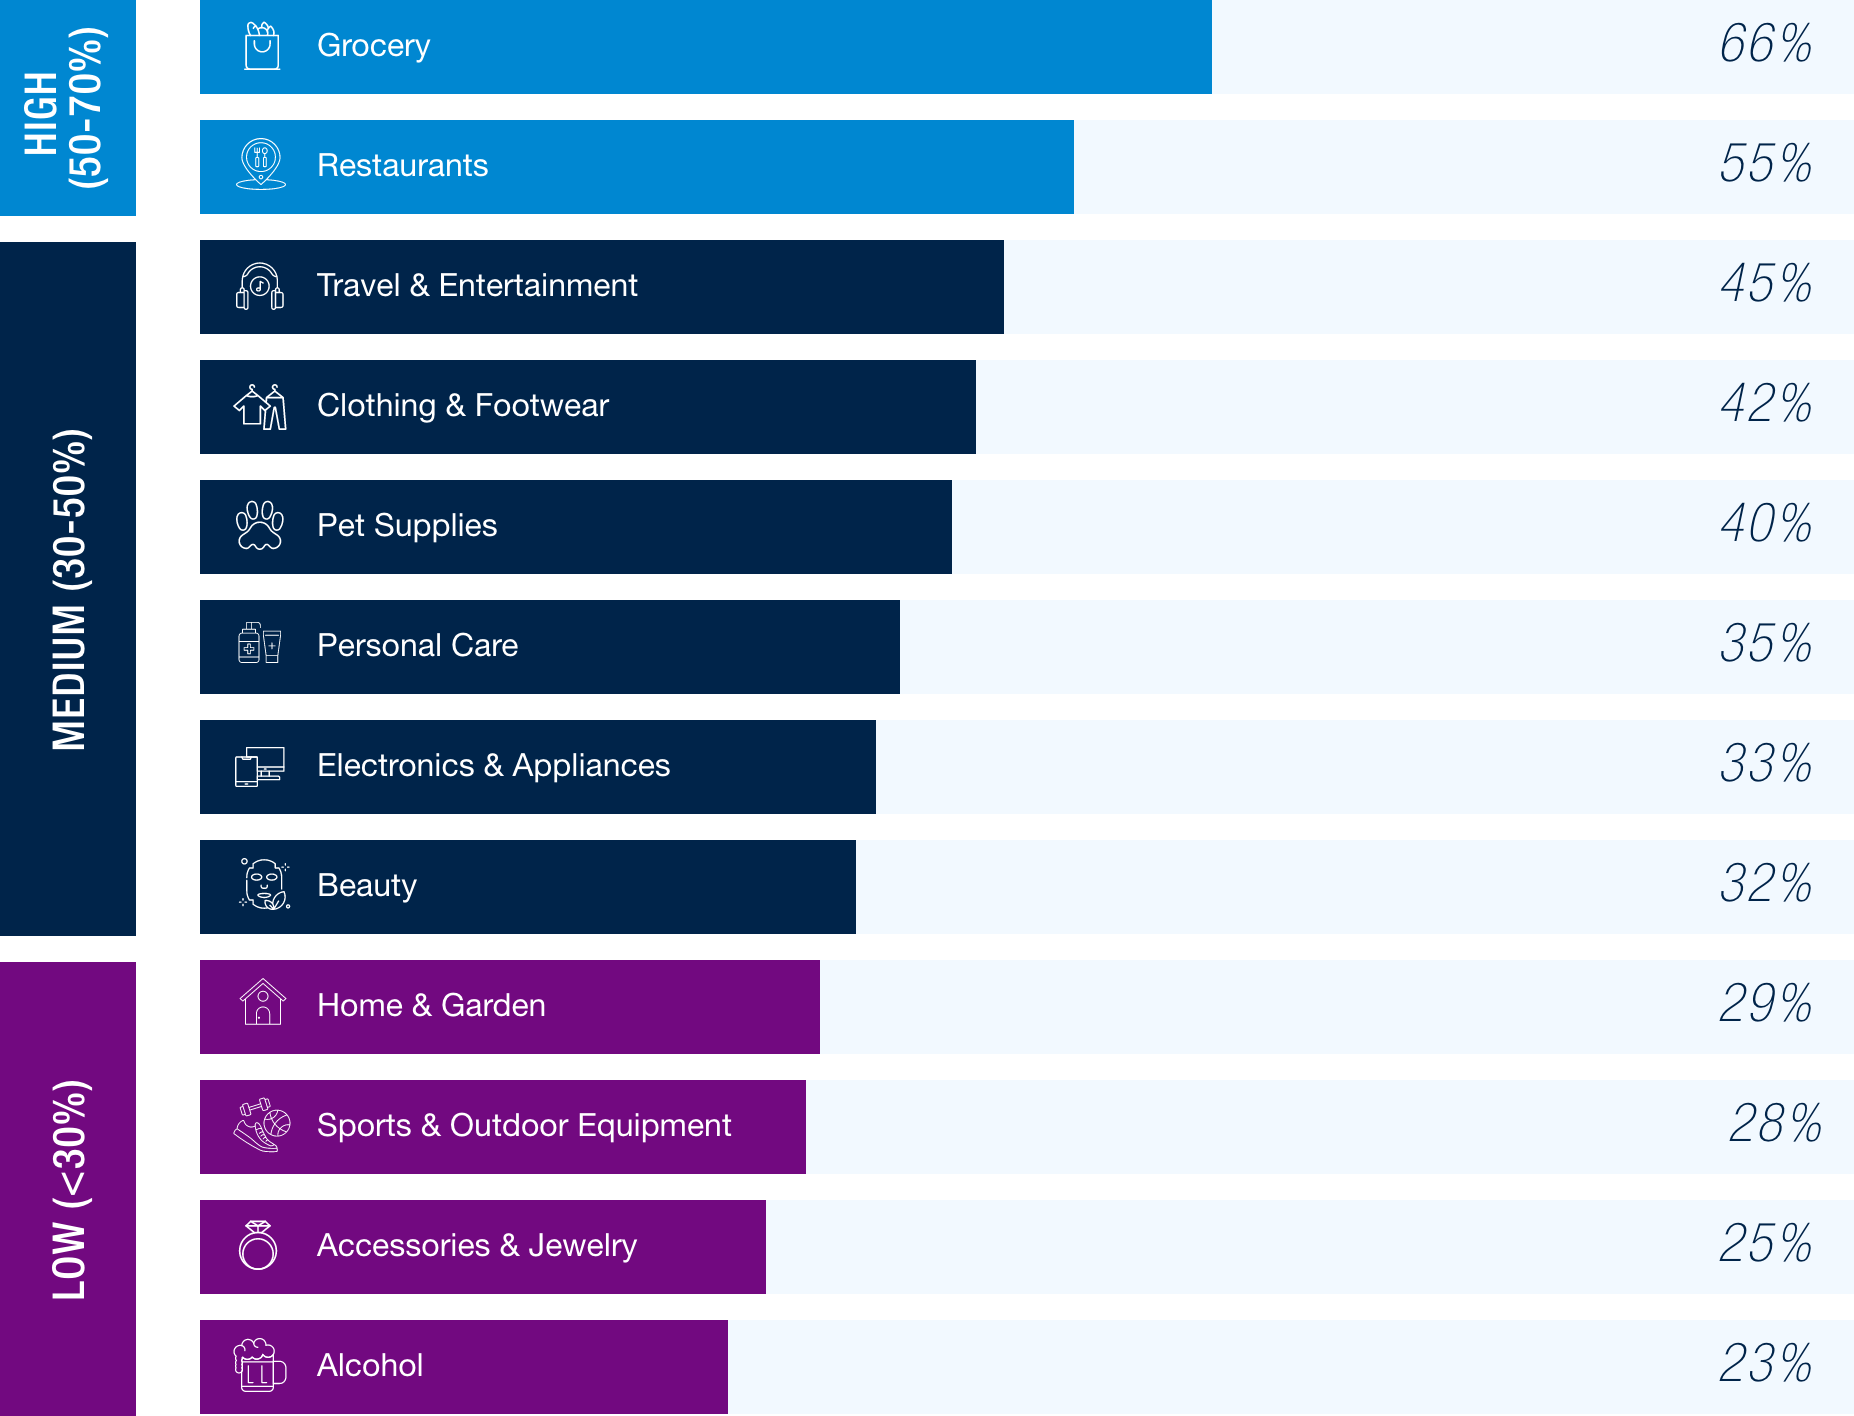
As consumers grow more selective and switch brands in search of better value, loyalty is harder to earn. Loyalty programs have become table stakes in certain categories – an expected offering that retailers must leverage strategically to drive lasting loyalty. Consumers today actively engage with free-to-join programs to stretch their spending power, making them a critical tool for value-seeking shoppers. Grocery remains the top category for participation (66%), followed by restaurants (55%), then travel and entertainment (45%), with usage tapering off in categories like accessories (25%) and alcohol (23%). To earn lasting loyalty, retailers must deliver tangible value where it matters most.
Loyalty Program Participation by Category
To understand how loyalty programs influence consumer behavior, we asked participants whether program membership prompted them to make a purchase. Grocery loyalty programs stood out as the most effective in driving purchase decisions, with participants most likely to say their involvement directly encouraged them to buy. These programs likely lead because they represent frequent, essential purchases, delivering tangible savings on everyday needs.
Loyalty Program Influence on Purchasing Behavior1
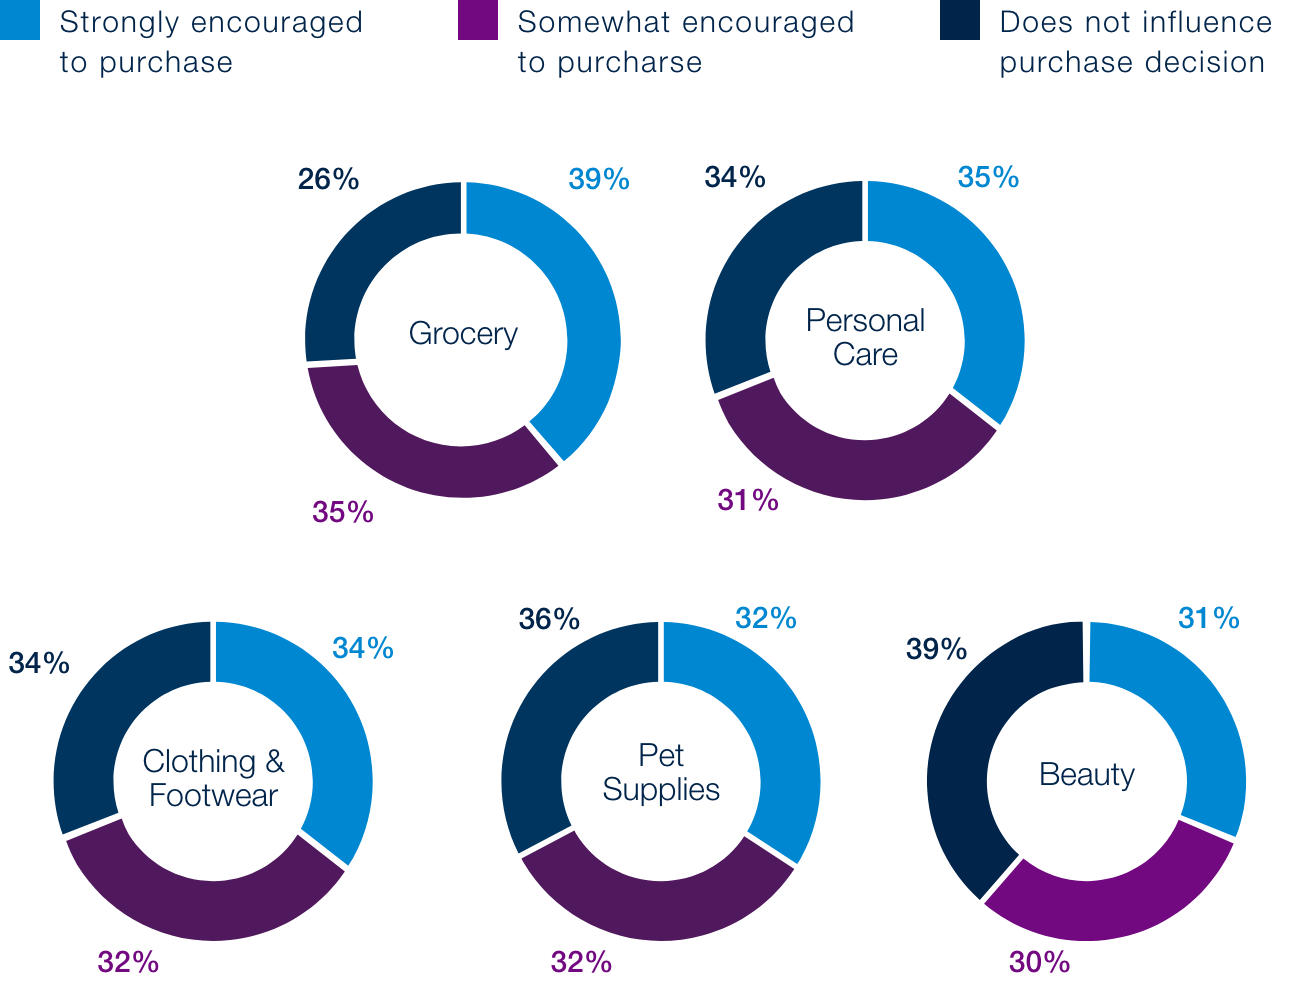
1Data excludes individuals not enrolled in loyalty programs
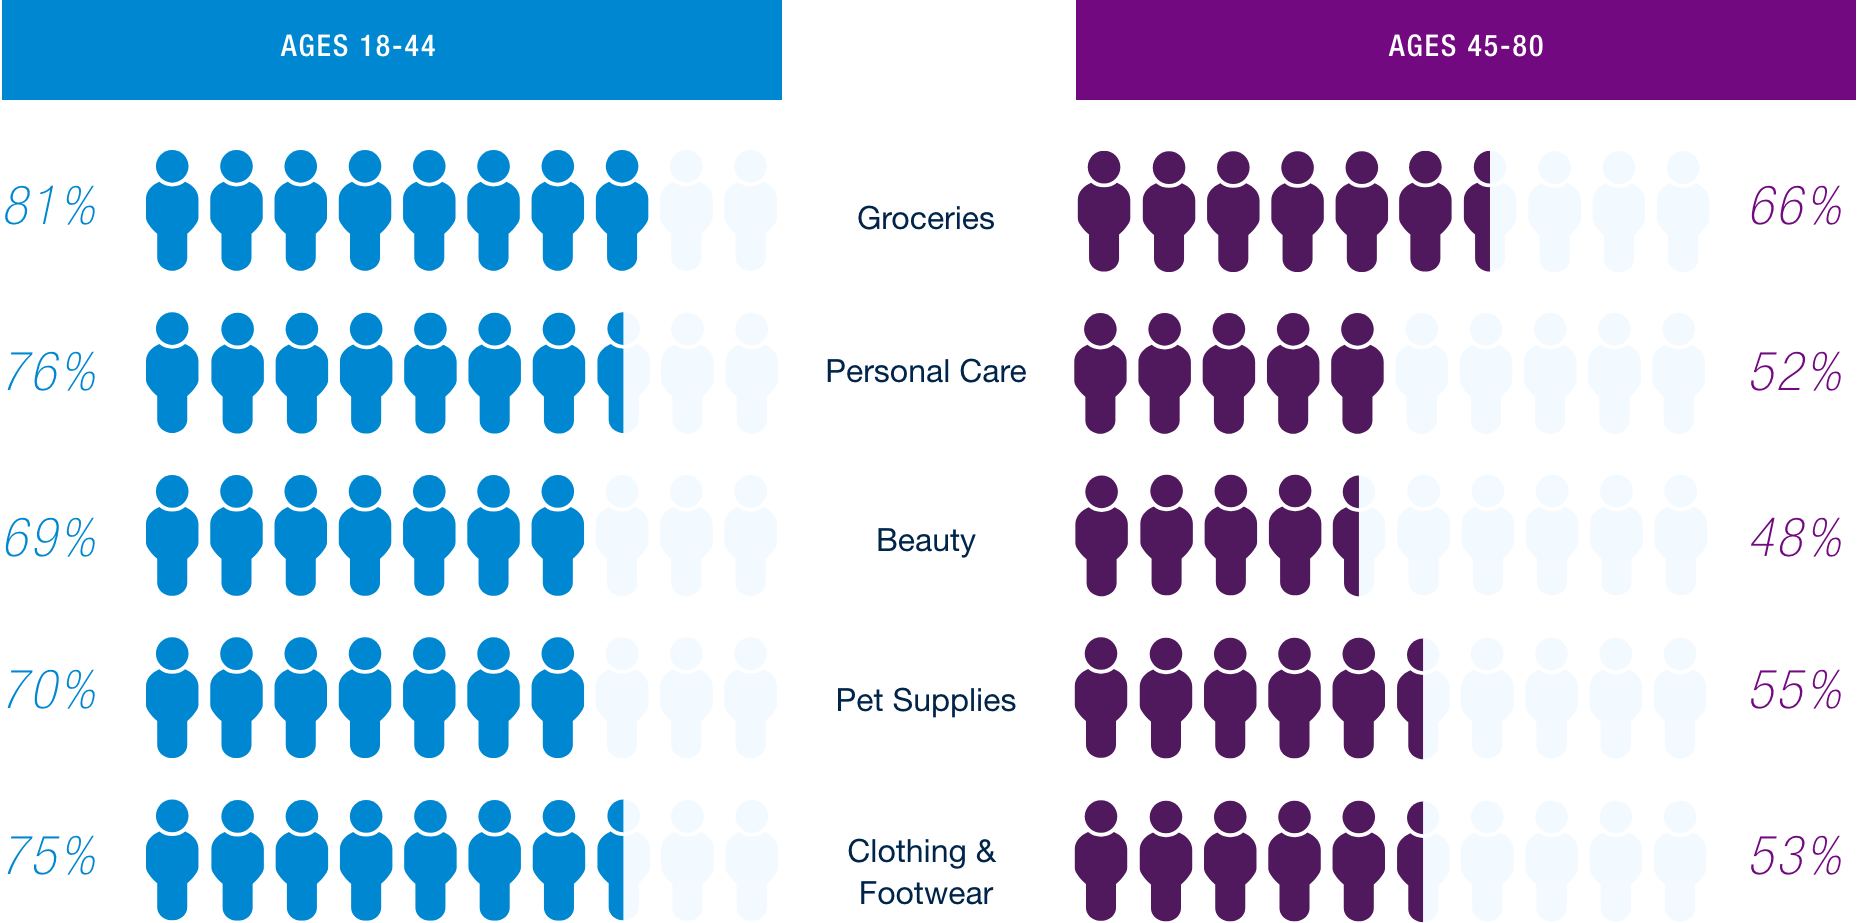
On average, loyalty programs influence younger consumers (ages 18-44) 20 percentage points more than older consumers. While impact varies across categories, well-designed loyalty programs can effectively drive repeat engagement, highlighting how rewards and incentives can boost shopping frequency in everyday spending areas.
Consumers Encouraged to Continue Purchasing due to Loyalty
Program Participation by Age Group
Consumers are engaging with loyalty programs for a range of reasons, with exclusive perks (52%) and opportunities to earn more points (45%) ranking as top motivators – trends that hold steady across age and income groups. However, younger consumers also place greater value on the convenience offered by integrated technology. Among respondents aged 18-44, 42% say they’re more likely to spend more with a retailer if faster checkout is available through saved information, compared to just 26% of those aged 80 and older. This highlights a clear generational divide in how technology enhances loyalty and drives repeat purchases.
Loyalty Program Factors that Increase Spend by Age Group1
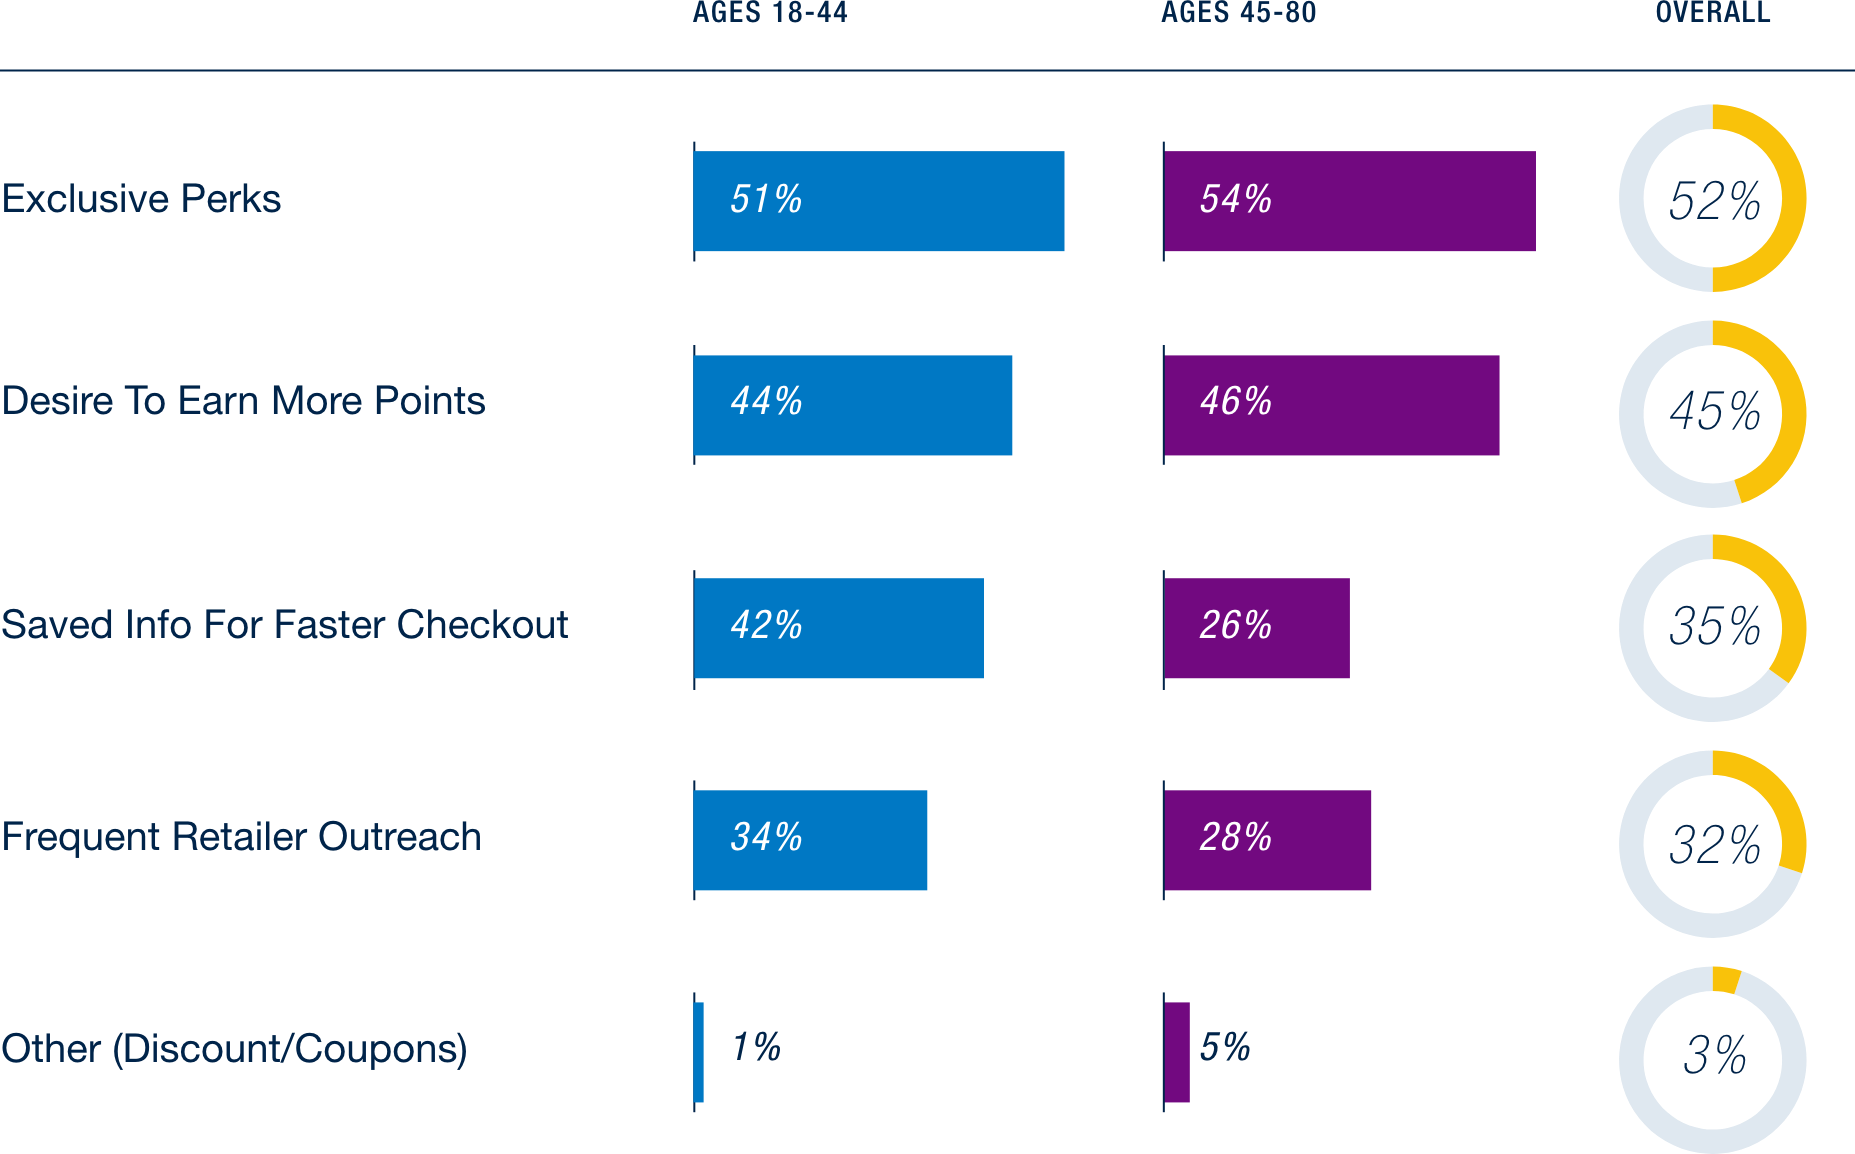
1Data excludes individuals not enrolled in loyalty programs

Technology’s impact on consumer buying behavior
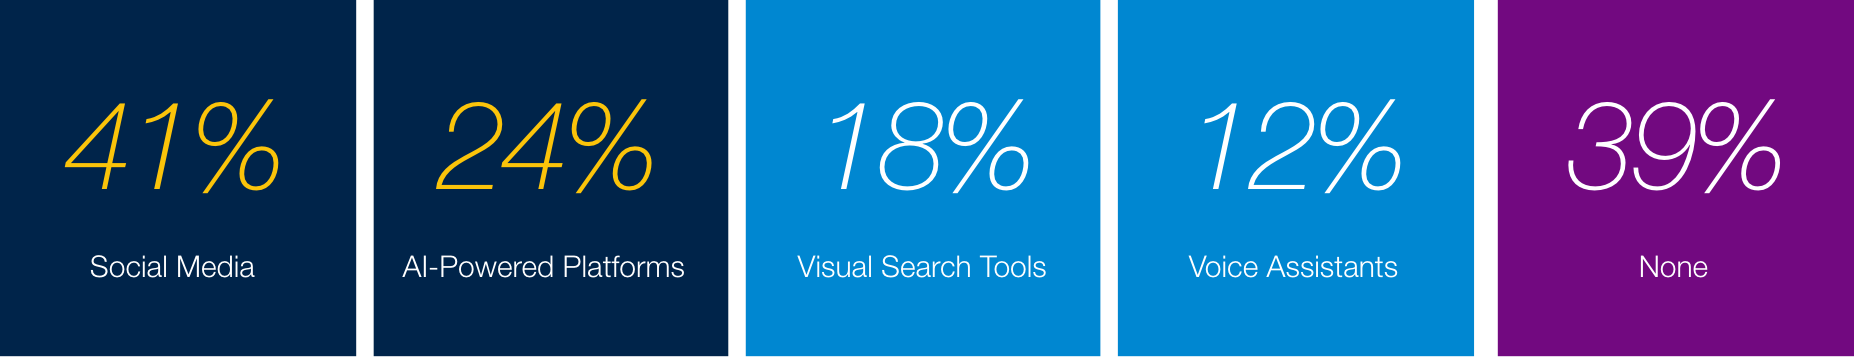
In the last six months, 61% of respondents reported that interactions with technologies have significantly impacted their buying decisions. Social media stands out as the top technology influencing consumer purchases. As anticipated, younger consumers (18-44) were more influenced by technology in their shopping habits than their older counterparts. The most pronounced difference appeared in social media-driven purchases, where 56% of shoppers aged 18-44 reported being significantly influenced – compared to just 27% of those aged 45-80.
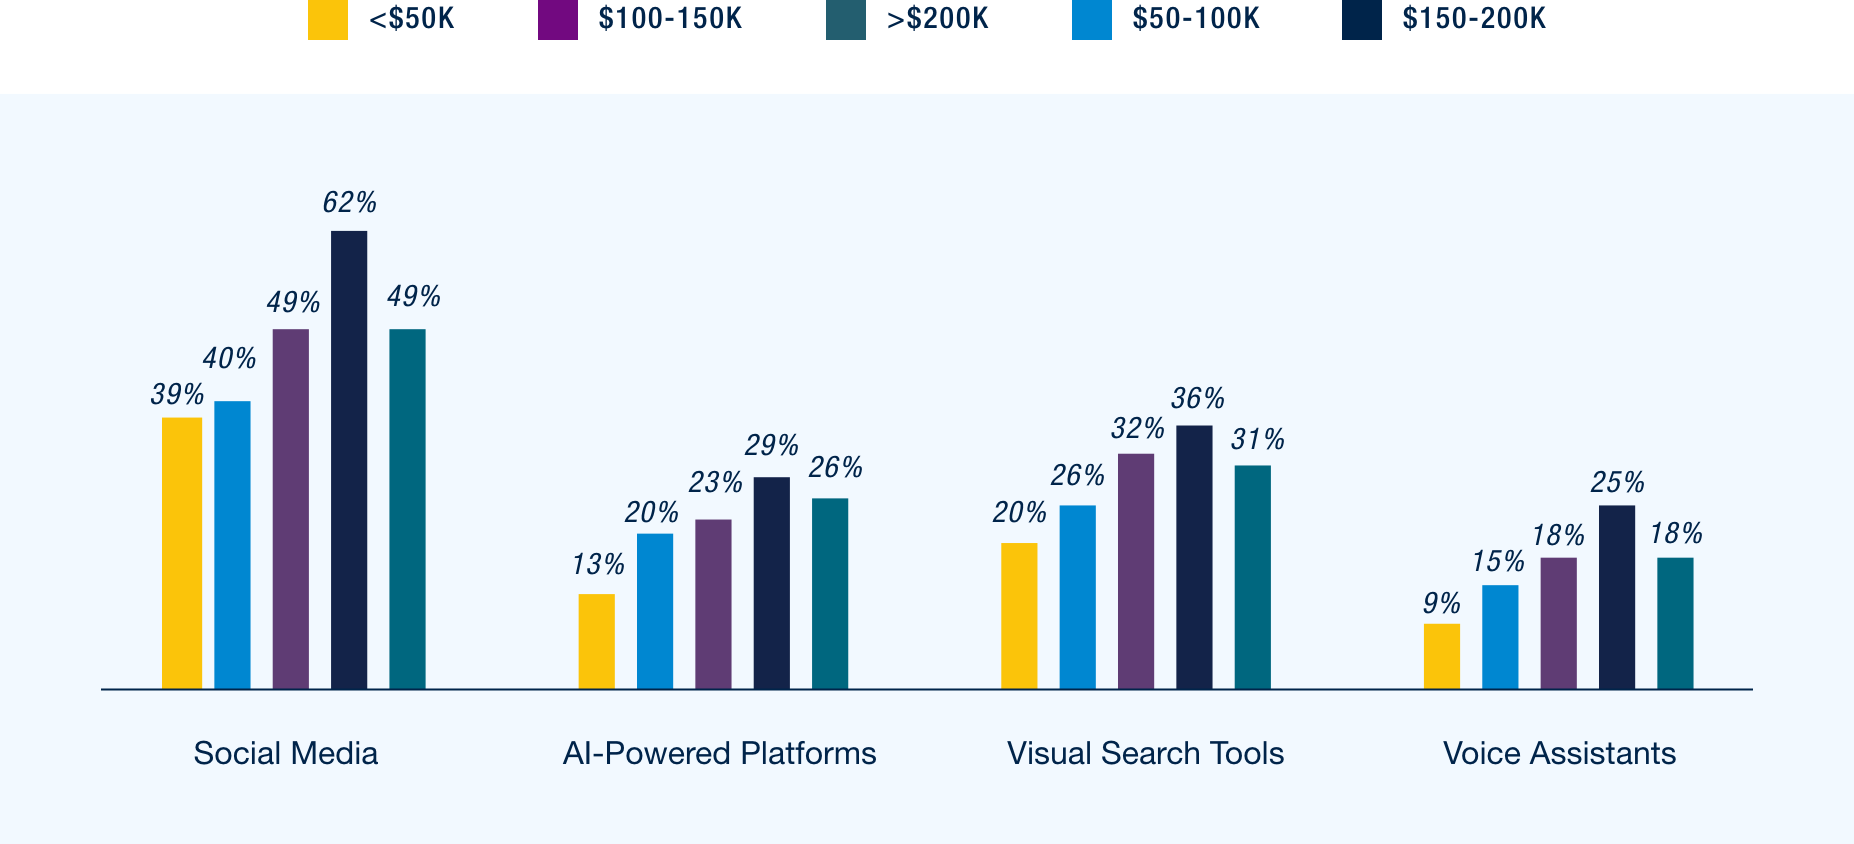
Technologies Significantly Influencing Purchases in Last 6 Months
While the use of shopping technologies generally increases with household income, social media still stands out. Among respondents with HHI under $50K, 39% said social media has influenced their purchasing decisions, showing that even though overall tech adoption rises with income, medium-to-lower-income consumers are actively engaging with certain digital tools, particularly social platforms.
Technologies Influencing Purchases in Last 6 Months by HHI
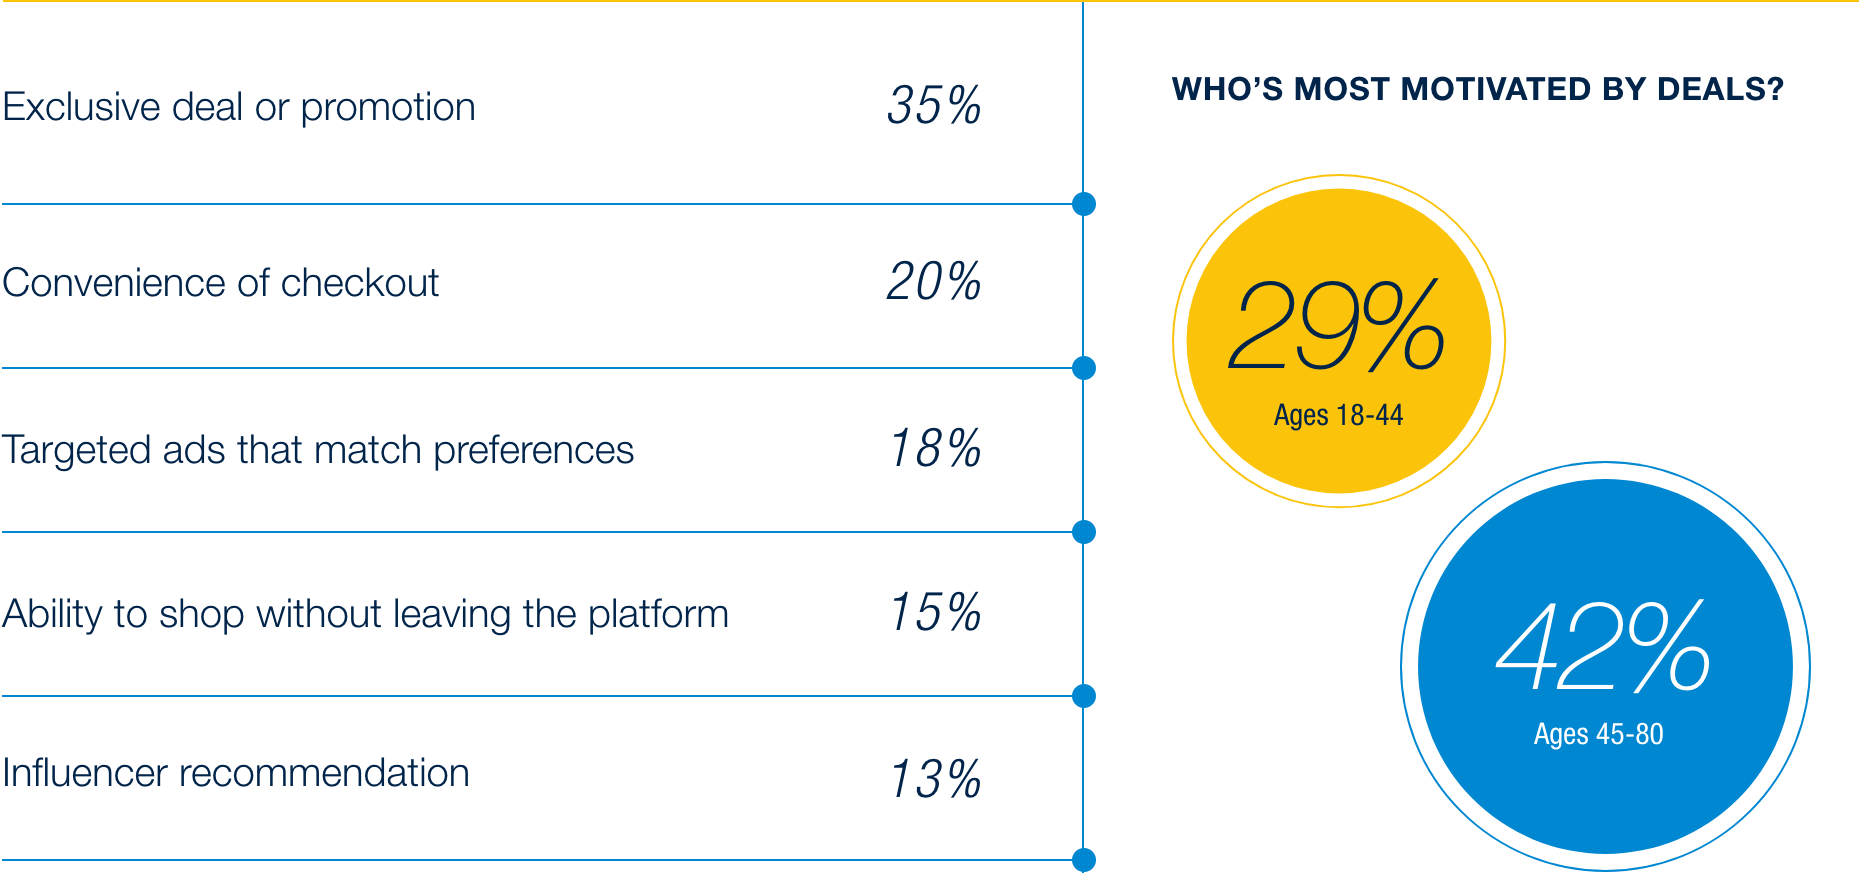
As social media plays an increasingly large role in shopping behaviors, motivations for purchasing through these platforms vary by age. Exclusive deals or promotions are the top driver across all age groups, with consumers aged 45-80 more influenced by these offers than those aged 18-44, showing a 13-point gap. For older consumers, deals or promotions on social media drive 42% of their purchases, compared to 28% of younger consumers.
Meanwhile, younger consumers are more likely to be swayed by influencer recommendations, with 17% citing this as a factor versus 7% of older consumers, highlighting the growing influence of digital voices on younger audiences.
Social Media Shopping – Factors that Most Encourage Purchases
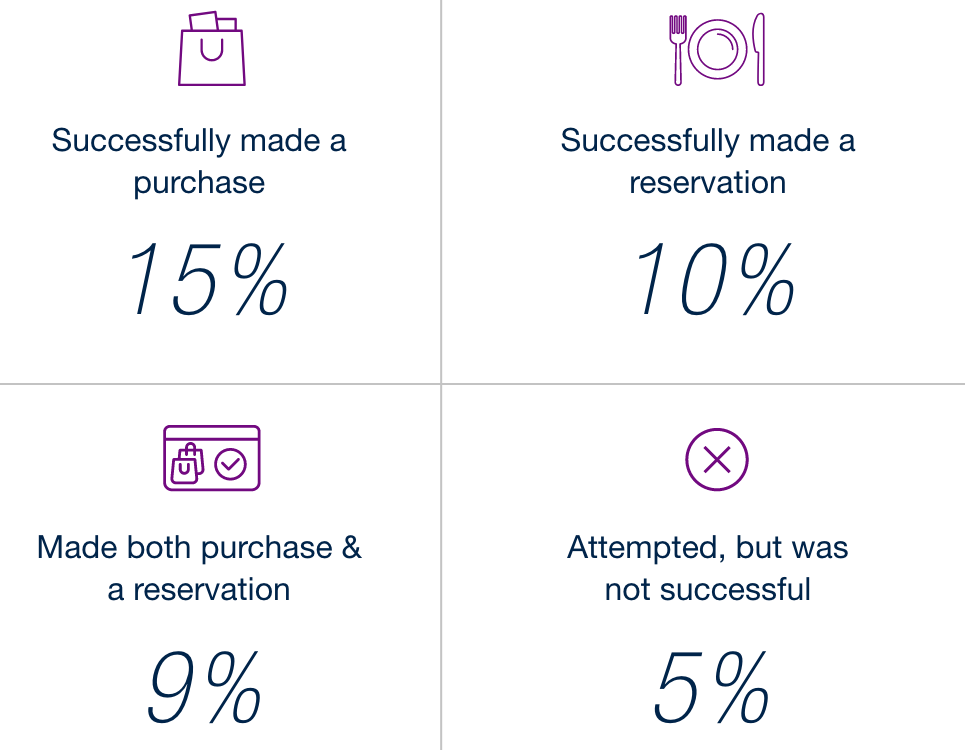
Of the respondents, 39% have attempted to use a voice assistant for a purchase or reservation, and of those, 88% were successful. This indicates that while there is still room for retailers to refine the technology and user experience, current usage and success rates point to strong potential for broader adoption of voice-assisted shopping by both consumers and retailers.
Use of Voice Assistants to Make a Reservation or Purchase


Respondents source at least half of all their Food & Beverage needs through subscription services
Subscription service models remain a trend for retailers to watch, with disruptors like Birchbox in beauty and Blue Apron in meal kits demonstrating the model’s potential to drive engagement across categories. While interest is highest in categories like restaurants and food & beverage, the appeal of these programs varies by age group – particularly with younger consumers showing greater engagement. For retailers, this highlights an opportunity to tailor subscription offerings to different demographics and build more consistent, long-term customer relationships through added value and convenience.
Use of Subscription Services by Category – % of Purchases

Consumers are entering the season with a cautious, value-driven mindset, shaped by economic divides and inflation fatigue. While higher-income shoppers remain more optimistic, most are focused on efficiency and familiar routines. Rather than spending more, they’re making selective trade-offs to stretch budgets. Brands that offer strong value, simple experiences, and loyalty incentives, especially via digital tools and store brands, will be best positioned to retain consumer trust.

Methodology
Respondents matching U.S. adult population according to gender, age, ethnicity, region & income