Consumer Sentiment Survey Fall 2025
Back to All Insights
Amid Economic Uncertainty, Consumers Are Increasingly Divided On Their Financial Plans

In August 2025, A&M Consumer and Retail Group surveyed over 2,000 U.S. consumers to understand their financial outlook, spending priorities, and shopping behaviors. Results show sentiment remains cautious, with higher-income households driving spending while lower-income groups pull back, tariffs weighing on price perceptions, holiday spending staying flat, and loyalty and subscriptions proving strong in everyday categories.
A widening financial divide is shaping behavior
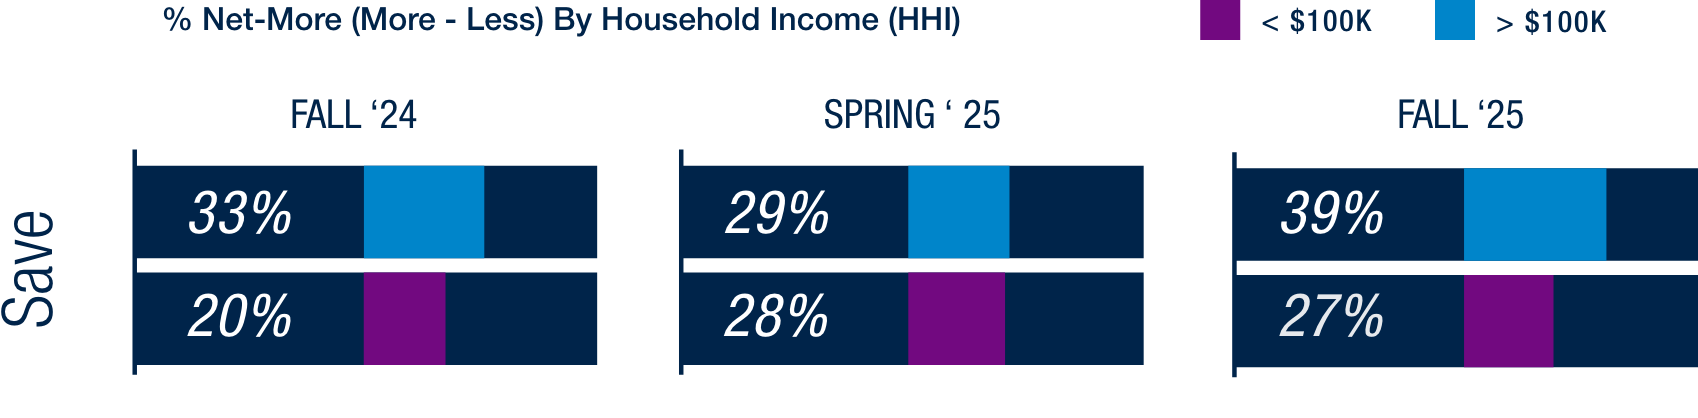
Higher-income consumers are increasingly confident, planning to spend, save, and earn more, while lower-income households show only cautious gains, easing pressure but still pulling back.
Tariffs remain top of mind
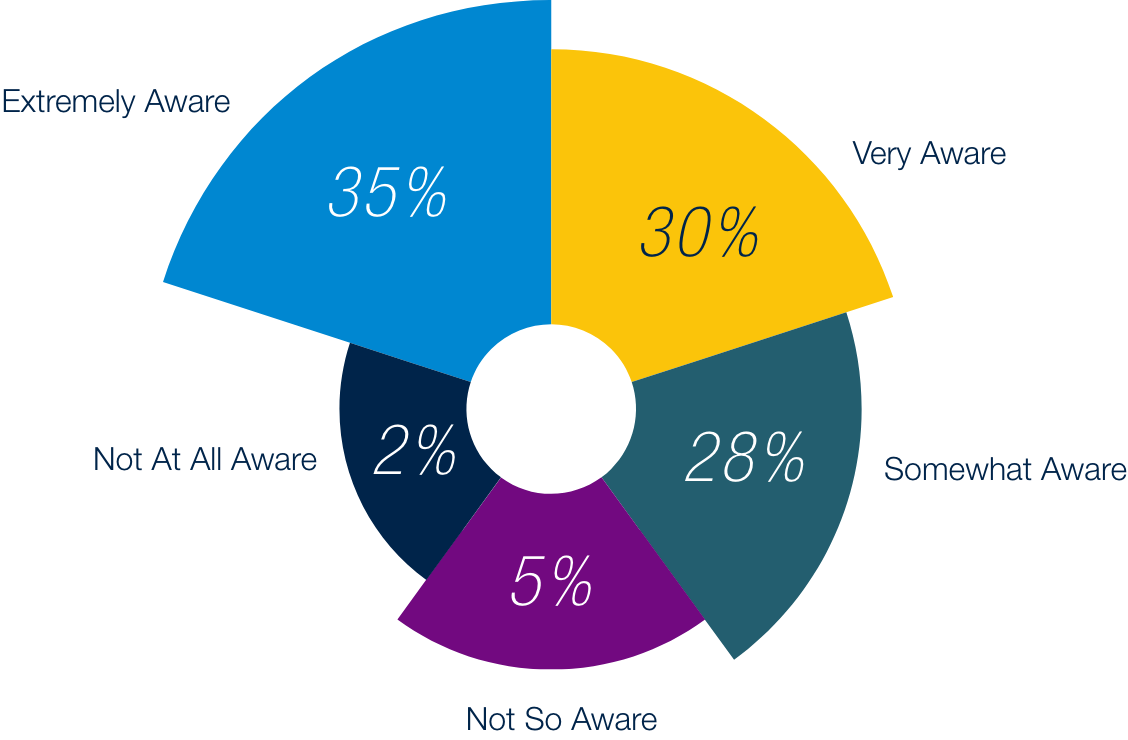
Awareness is nearly universal, with over a third of consumers extremely aware, and most reporting noticeable price increases.
Resilient yet cautious
Despite growing optimism, consumers remain cautious in an uncertain economy, continuing to prioritize value and make tradeoffs—choosing carefully where to spend, what to forgo, and which categories matter most.
Consumers prioritize health
In both alcohol and snacks, consumers point to health as their primary motivation for cutting back-whether it’s reducing or abstaining from drinking or choosing better-for-you option–underscoring the growing influence of wellness in shaping behavior.
Holiday spending stays flat
Consumers plan to spend no more than last year, with gift-giving and decorations seeing the sharpest cutbacks. The only bright spot: modest increases in spending on gifts for themselves.
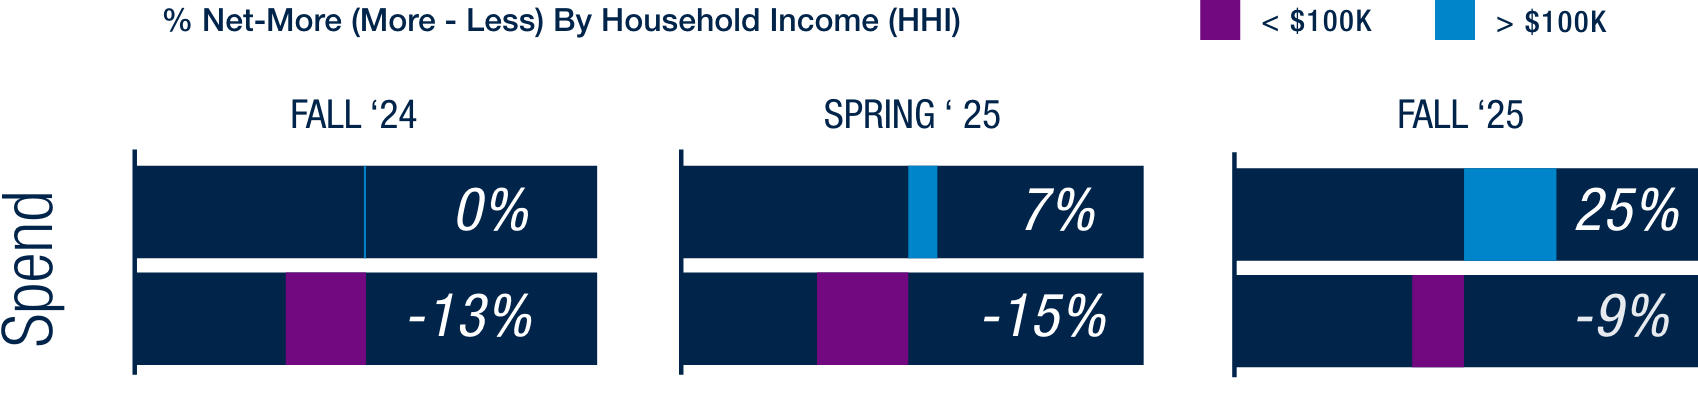
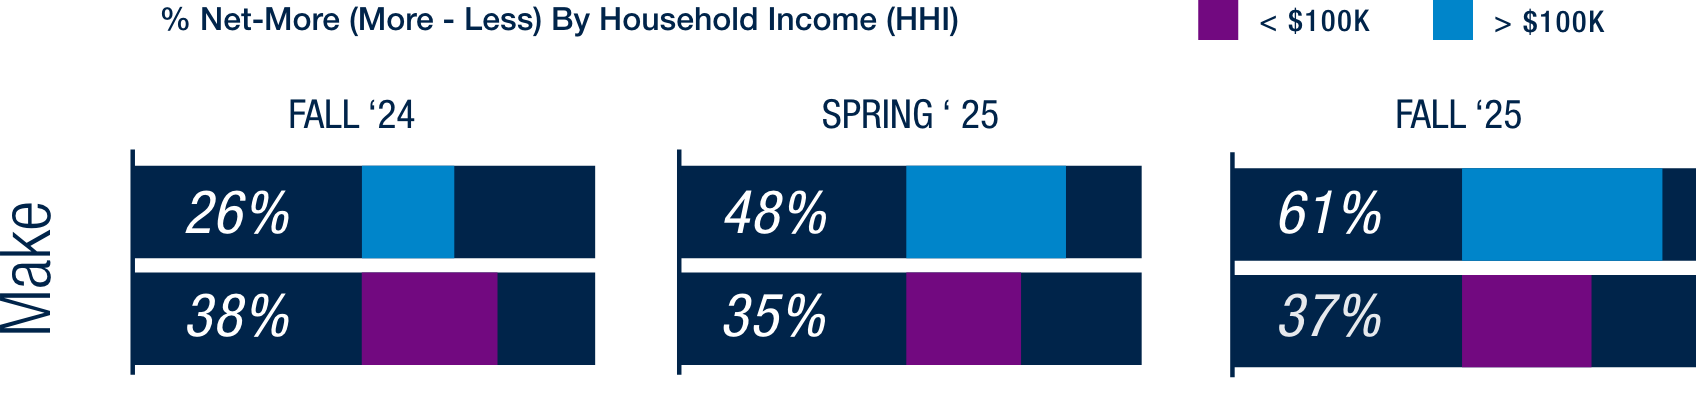
Higher-income households (HHI >$100K) are increasingly confident, reporting strong expectations for earning (61%) along with greater willingness to spend and save. The upward trend across intent to make, spend, and save was last seen in Spring 2023, also driven by high income households in non-discretionary categories despite economic concerns. For higher-income households, history looks to be repeating itself. At the same time, medium-to-lower income households (HHI <$100K) are showing early signals of cautious optimism, with improved outlook on plans to spend, modest improvements in earning expectations and steady saving intentions. Together, these results suggest higher-income confidence may fuel discretionary growth, while gradually improving sentiment among lower-income households points to a slow but notable easing of pressure on broader demand.
Consumer Financial Plans Historical Trends
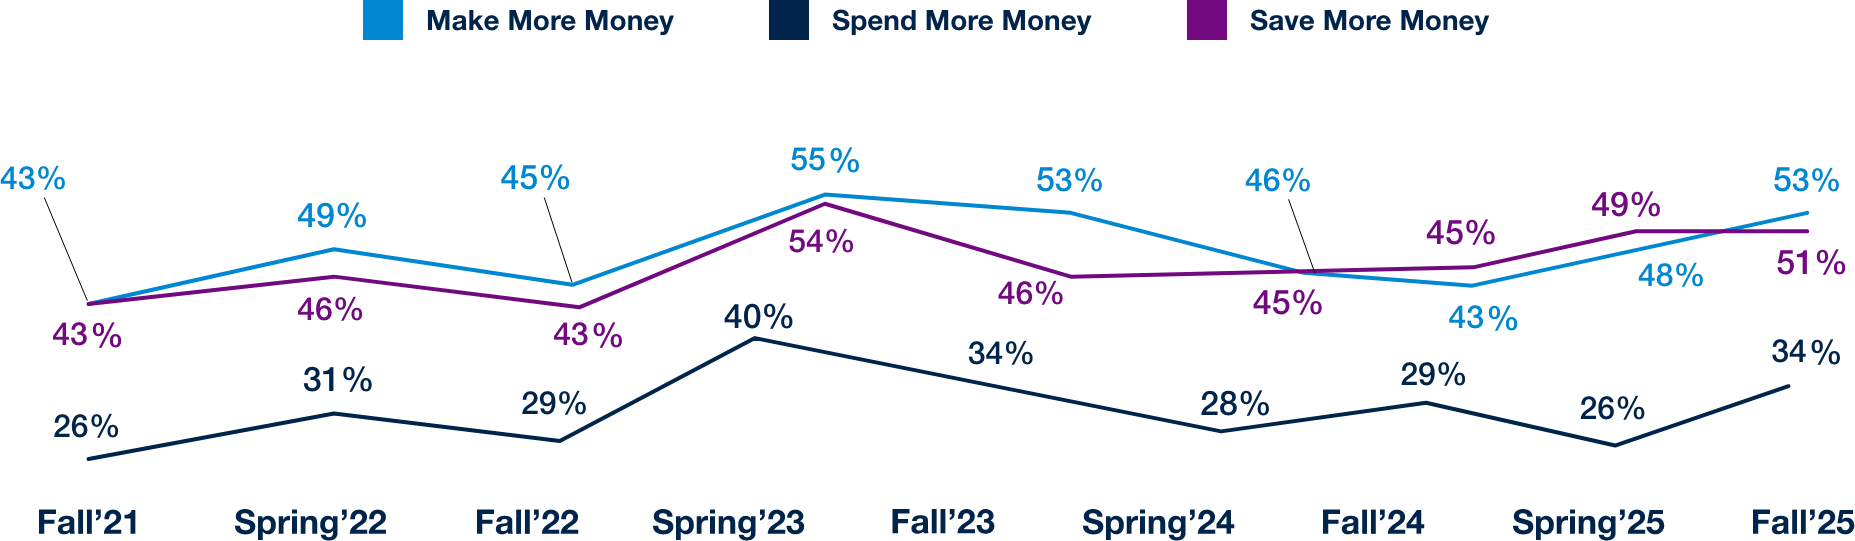
Consumer Financial Plans for Next 6 Months
- SPEND
- MAKE
- SAVE
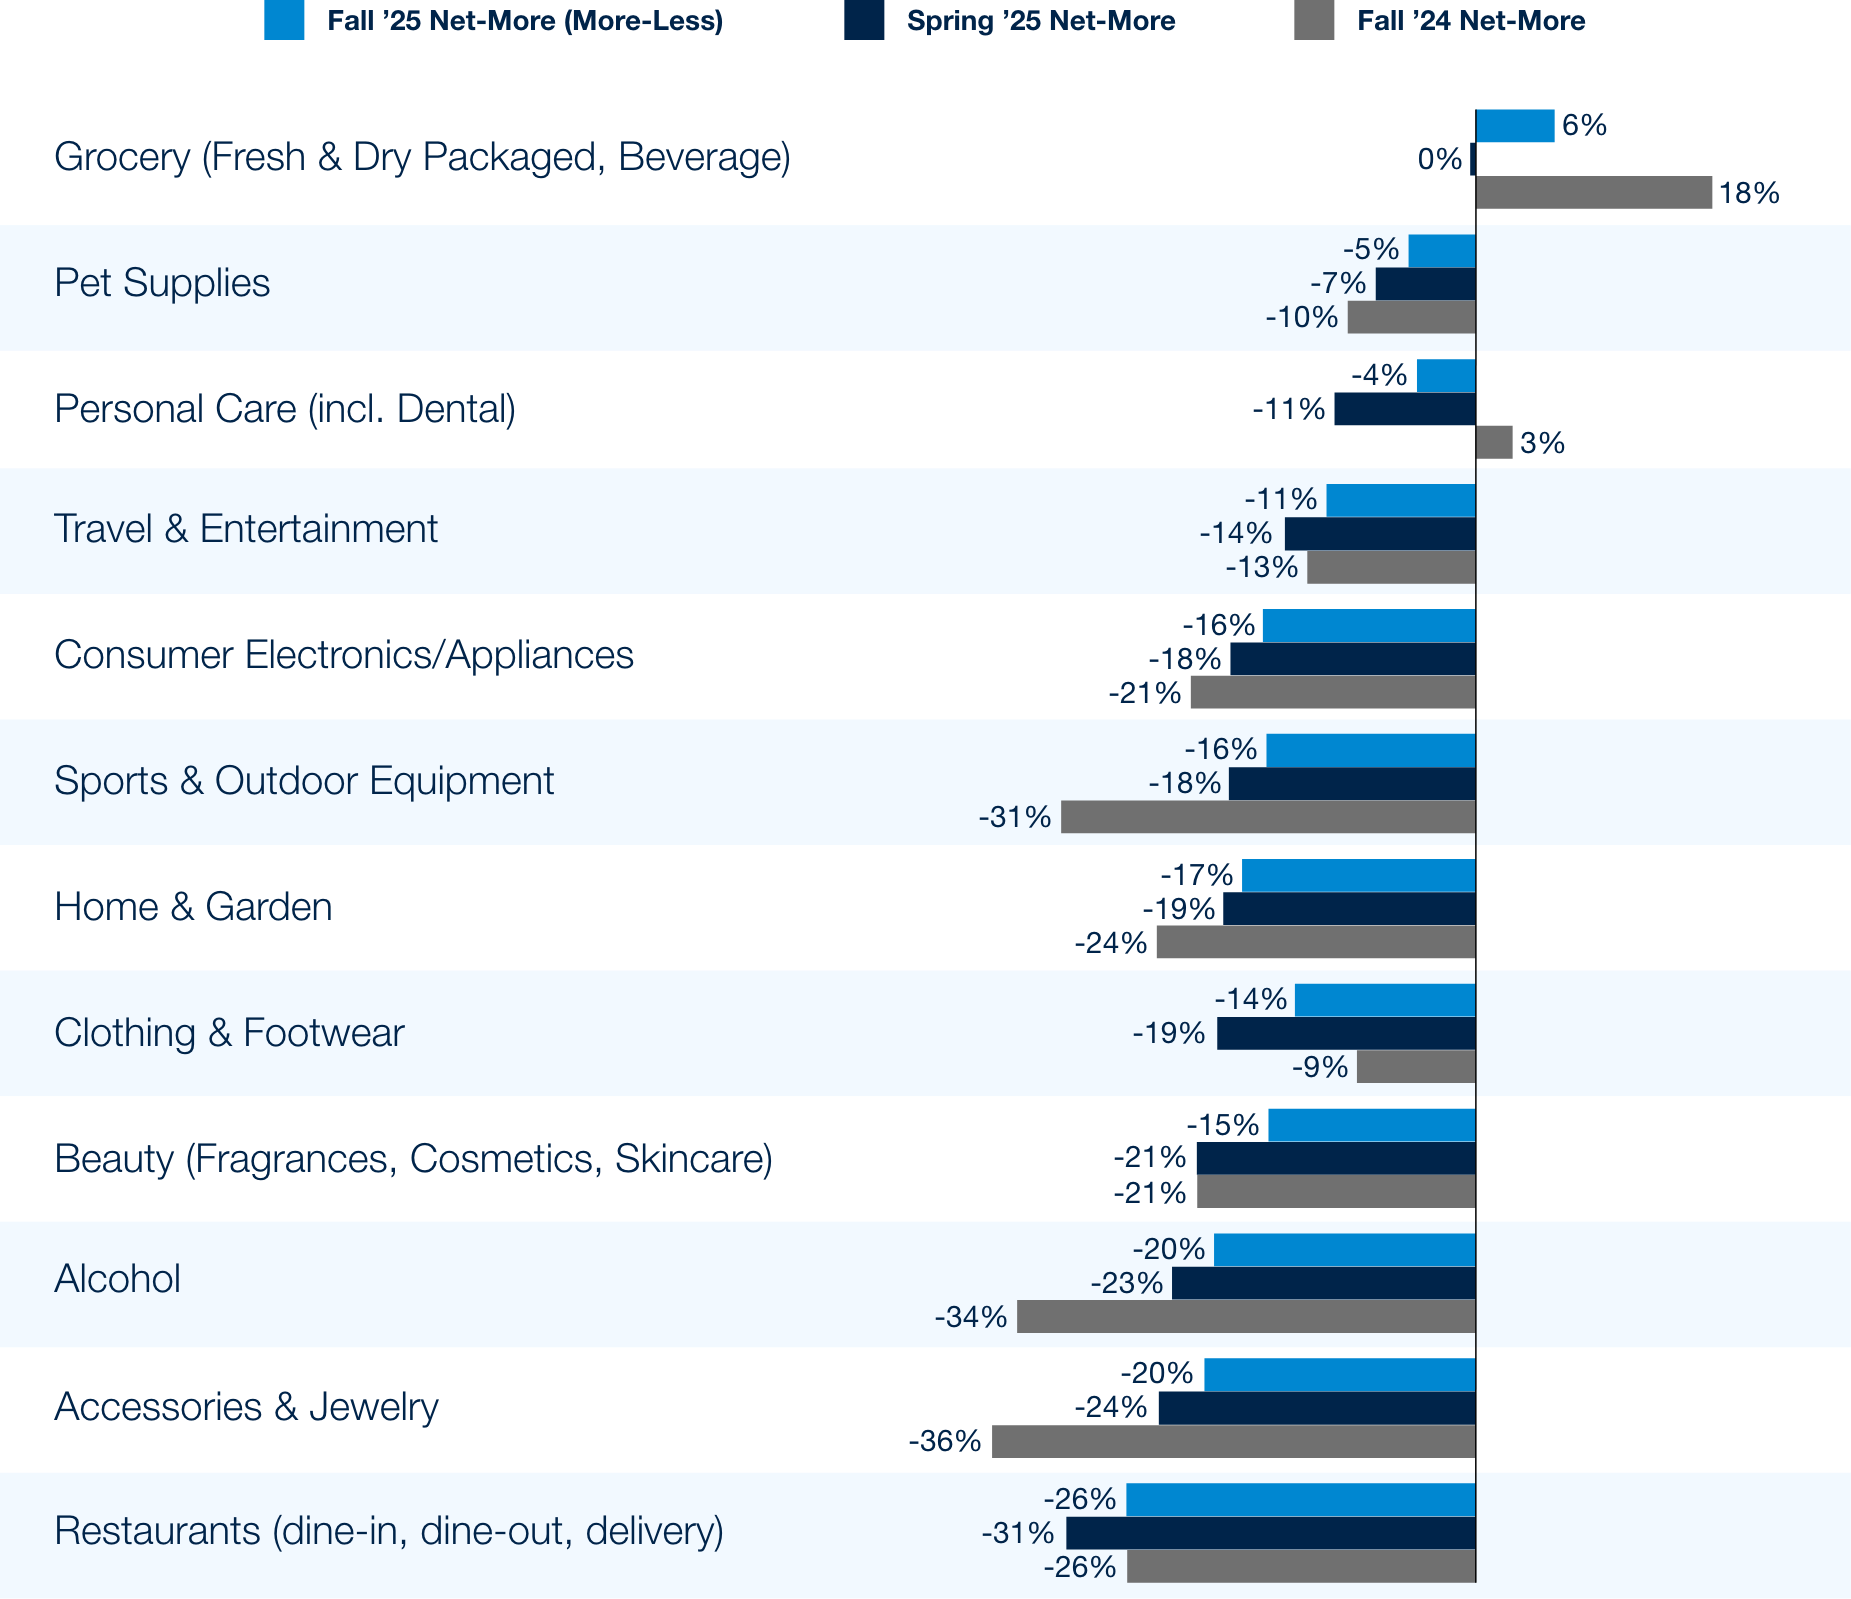
Category Spending Plans
This fall, consumer spending plans by category reflects improved optimism across both essential and discretionary categories, a modest uptick from Spring ’25 levels. Moreover, we see an uptick YoY from Fall ’24 to Fall ’25, primarily in discretionary categories such as beauty, electronics, and jewelry. However, it comes at the expense of basic needs and essentials such as grocery and personal care, which have experienced a decline YoY, suggesting consumers may be shifting their budgets from basic needs to fund discretionary purchases.
Tariff awareness is widespread, with 93% of consumers reporting at least some level of familiarity. Notably, nearly two-thirds describe themselves as extremely or very aware, underscoring that tariffs remain a visible factor shaping consumer sentiment.
Level of Consumer Awareness on Tariffs
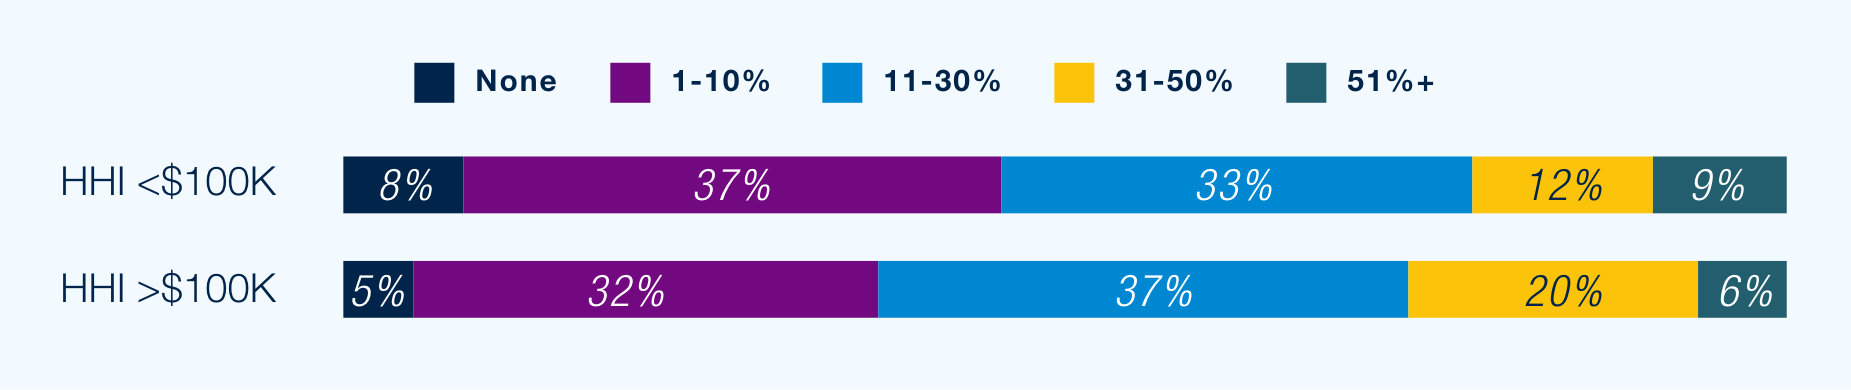
Tariffs have also impacted consumer perceptions of cost. A majority of consumers believe that tariffs have driven prices higher, with 63% of all consumers citing increases in the 11– 50% range. Higher-income households (HHI >$100K) are more likely to report steeper perceived price hikes, underscoring that tariffs are seen as a driver of rising everyday costs.
Perceived Price Increase due to Tariffs

Beauty
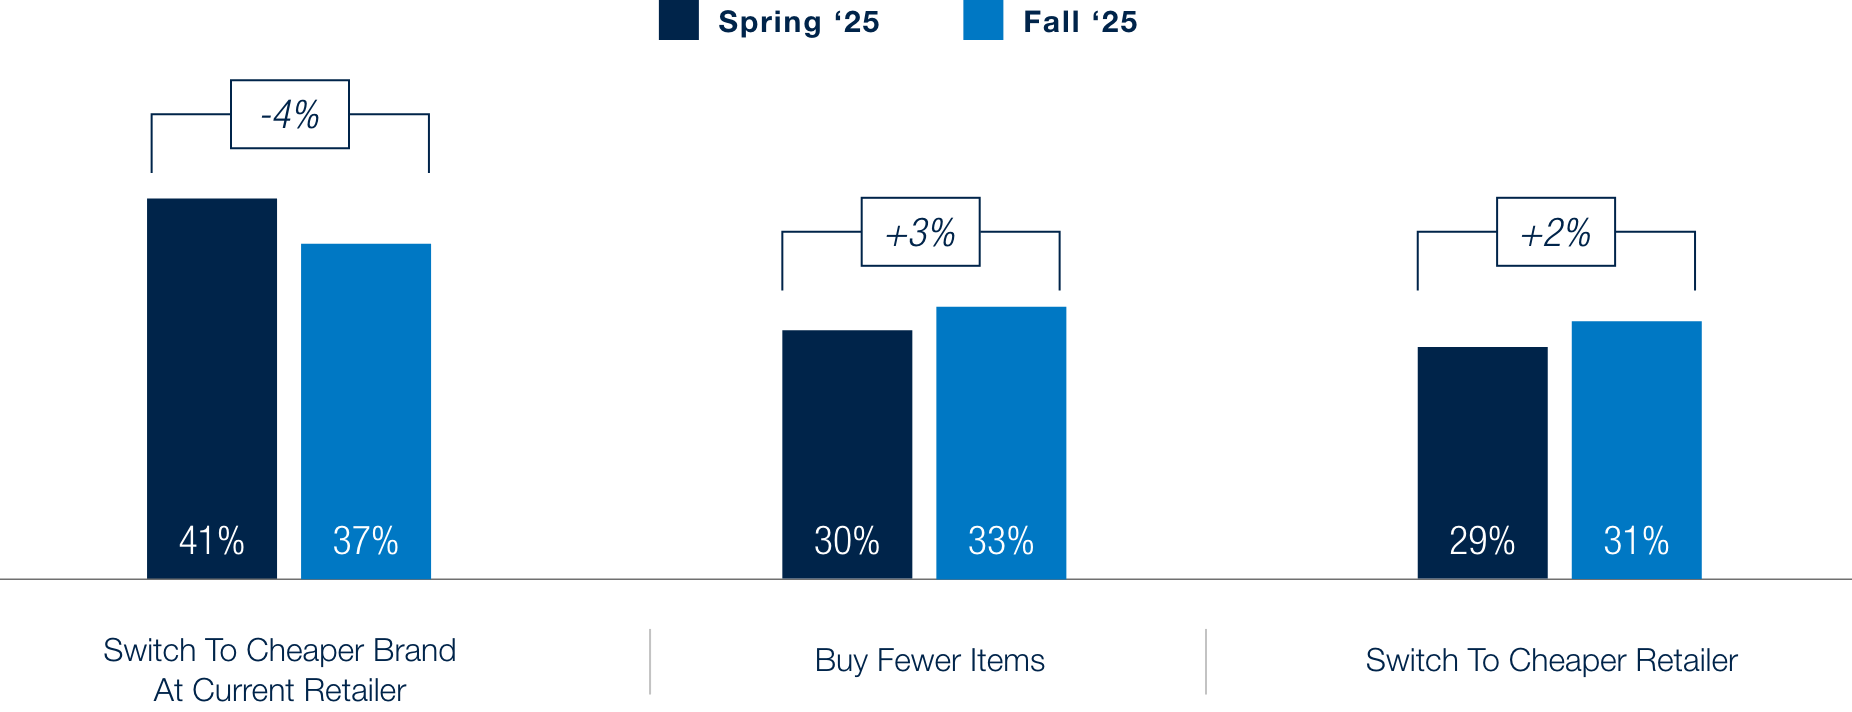
When it comes to beauty, brand loyalty remains low compared to retailer loyalty. Among cost conscious consumers, slightly fewer now plan to switch to less expensive brands at their current retailer (37% in Fall ’25 vs. 41% in Spring ’25). Instead, more are choosing to buy fewer items (33% in Fall ‘25 vs. 30% in Spring ‘25) or switch retailers for better prices (31% vs. 29%). This highlights the need for retailers to invest in retention within a routine-driven category.
Behaviors of Consumers Choosing Lower-Priced Alternatives
HHI Breakout of Switching Behavior
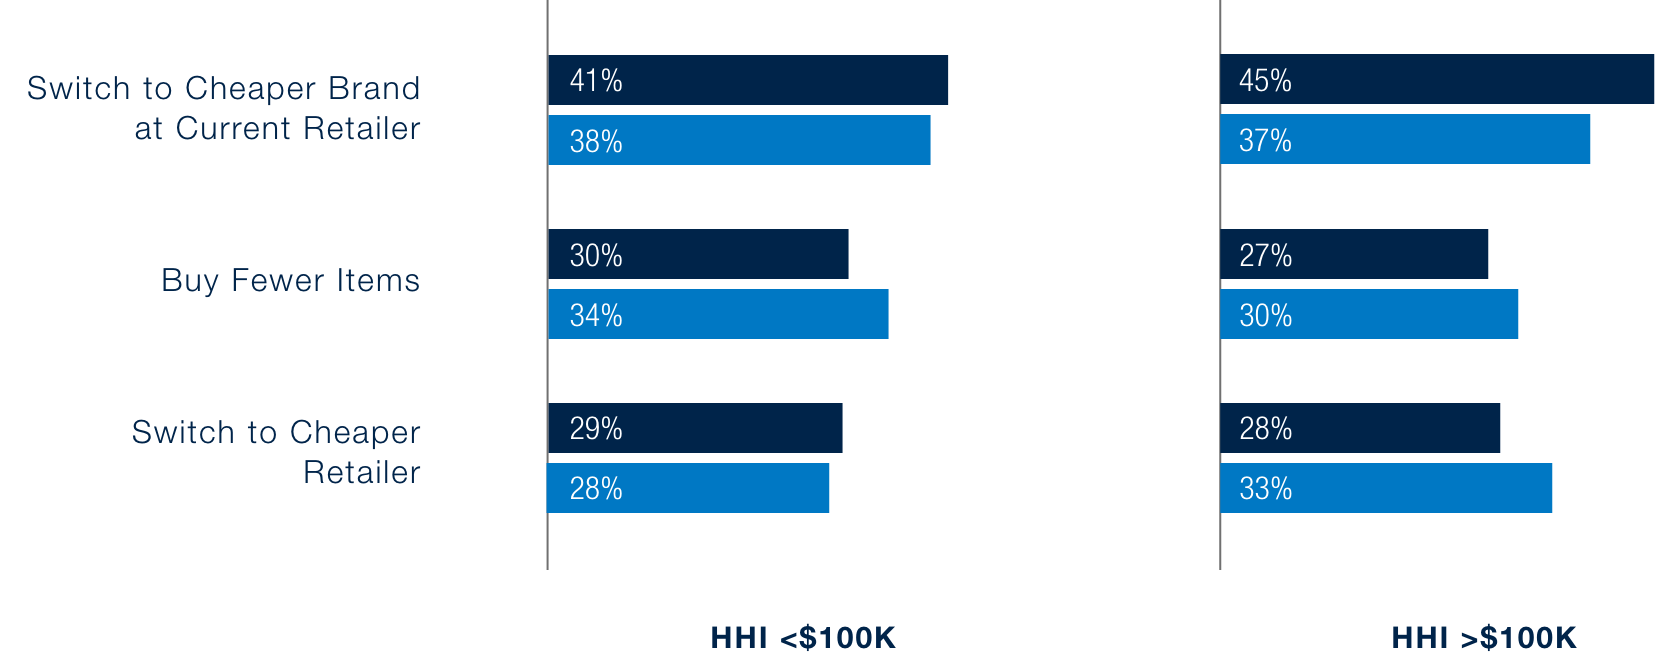
Compared to earlier in the year, higher-income households (HHI >$100K) are leaning more toward switching to cheaper retailers (33% in Fall ’25 vs 28% in Spring ’25). This reversal from prior patterns may signal the wider availability of premium beauty brands at lower-cost retailers, making retailer-switching a more attractive savings strategy for affluent shoppers.

Personal care
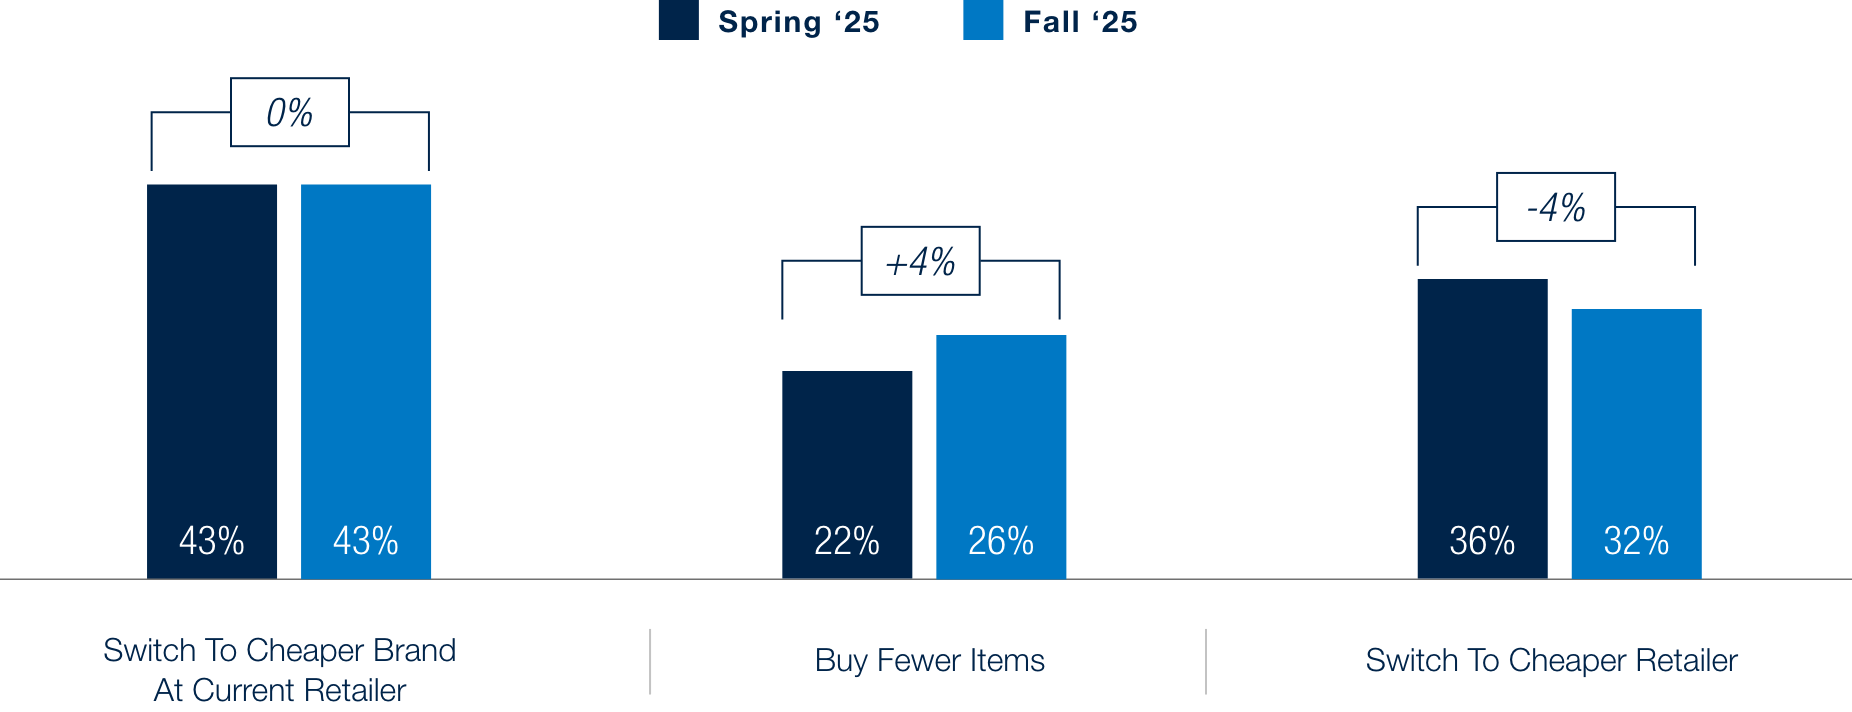
When it comes to personal care, brand loyalty remains low compared to retailer loyalty. Among cost-conscious consumers, 43% of consumers say they’ll switch to cheaper brands at their current retailer while 32% are willing to switch retailers entirely in search of lower prices. However, behaviors are shifting. More shoppers are choosing to buy fewer items (+4 pts from Spring to Fall ‘25), while willingness to switch to cheaper retailers has softened (–4 pts). This suggests that cost savings are being found more through moderation and brand-switching than through shifting retailers.
Behaviors of Consumers Choosing Lower-Priced Alternatives
HHI Breakout of Switching Behavior
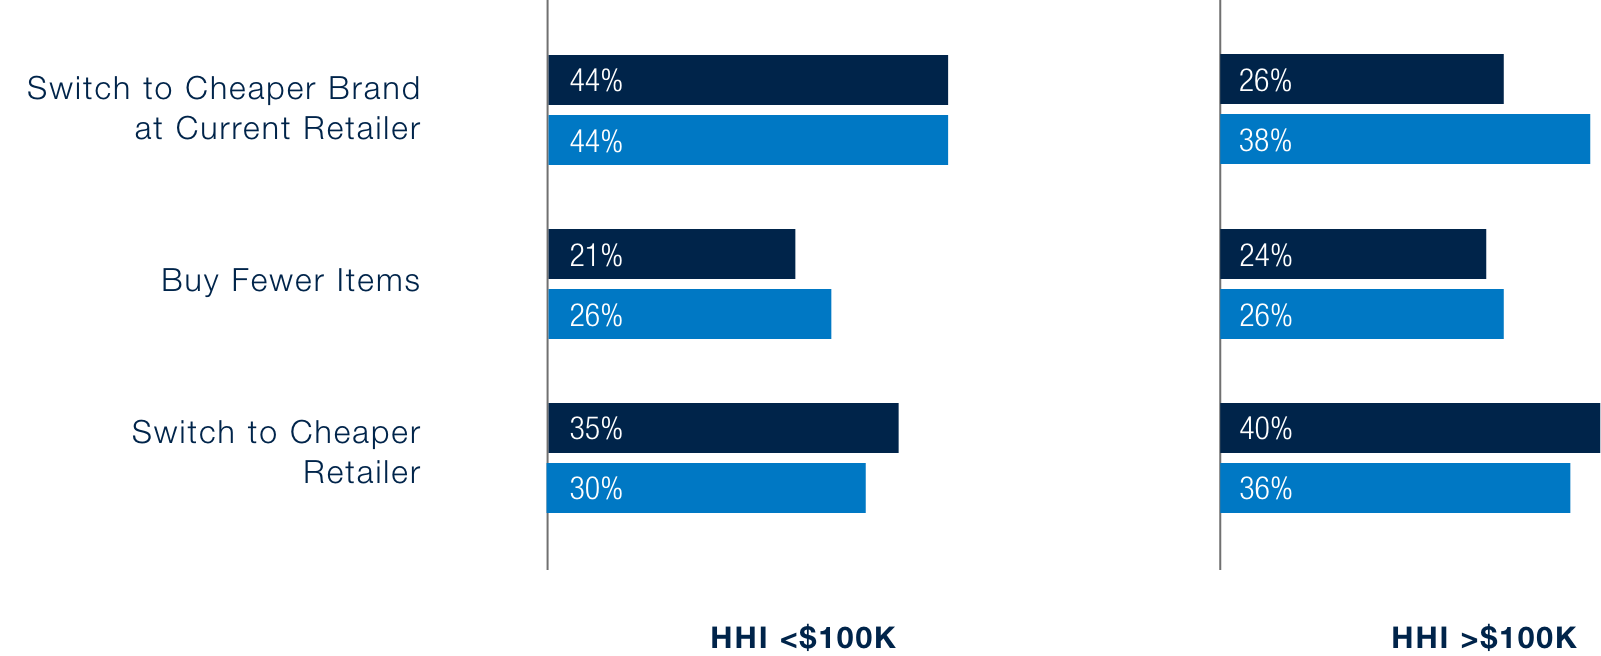
Across income groups, switching retailers as a strategy has softened. In personal care, both higher-income households (HHI >$100K) and lower-income households are more likely to trade down to cheaper brands at their current store (38% and 44%, respectively) than switching retailers in search of better prices (36% and 30%, respectively).
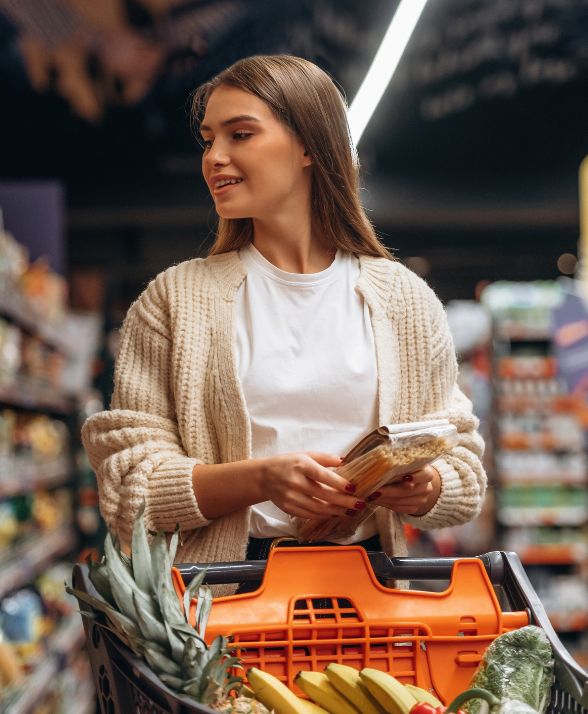
Grocery
Recent consumer insights highlight a shifting landscape in grocery shopping behavior. In the past 6 months, 43% of respondents cited that tariffs somewhat or significantly led to them decreasing grocery purchases. On the other hand, more consumers anticipate
increasing their grocery spend (26%) over the next three months than those expecting to reduce spend (19%). Among those tightening budgets, brand trade-down is the more common strategy–nearly half (49%) indicate they are more likely to switch to less expensive brands at the same store. Meanwhile, only 16% of these individuals plan to change to lower-cost stores.
Consumer Approach to Reducing Grocery Spend
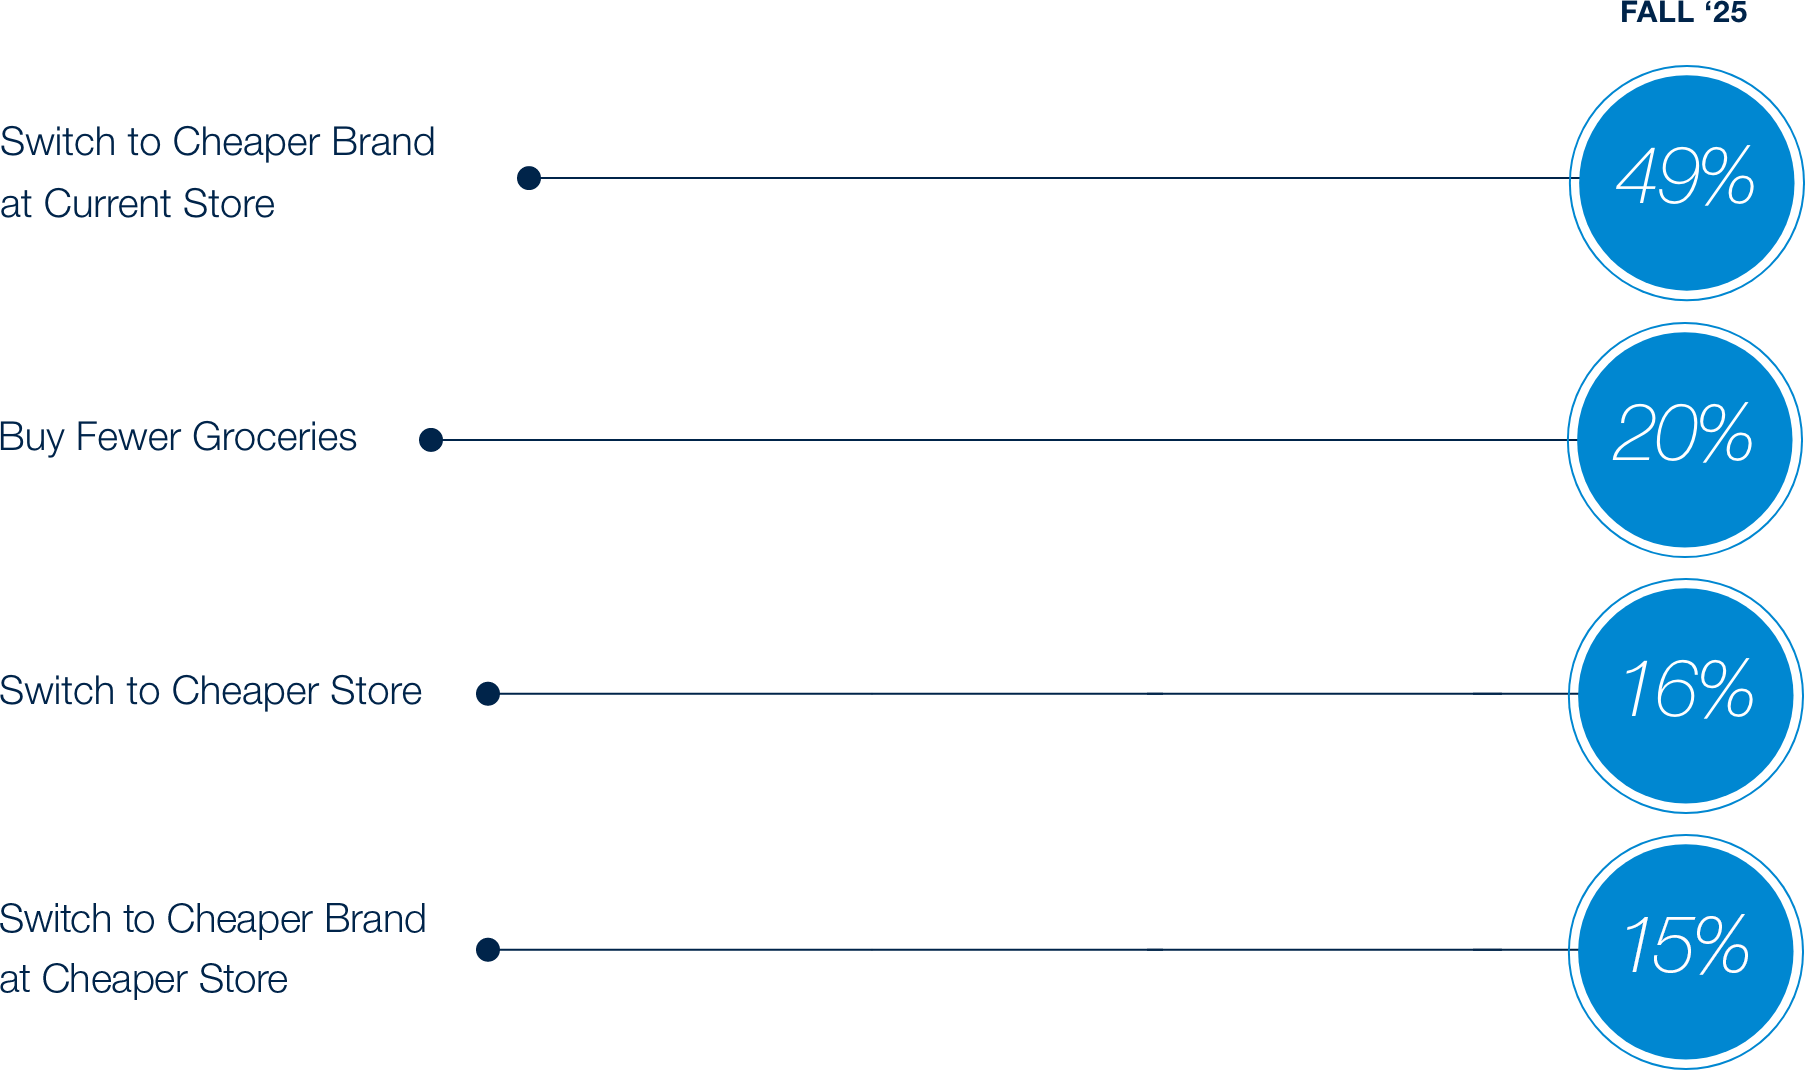
At the same time, behaviors over the past six months suggest a sustained pivot toward value focused
channels. We see that consumers have increased their trips to lower priced grocers, with 59% having reported making increased trips the last 6 months, an increase from 55% in the previous cycle. Moreover, 61% households with $100k+ income reported increased frequency at lower-priced grocers compared to 58% of households with <$100k+ income. Consumers across the spectrum are reflecting a concern over increasing prices at traditional grocery outlets and are adjusting their spending habits to manage household budgets.
Frequency of Store Brand Purchases in Grocery
Beyond lower prices and better deals, 17% of consumers also value the convenient locations of lower priced stores. This perspective aligns with Aldi’s aggressive expansion strategy—opening more than 225 stores across the U.S. in 2025 alone, with plans to surpass 800 additional openings by the end of 2028.
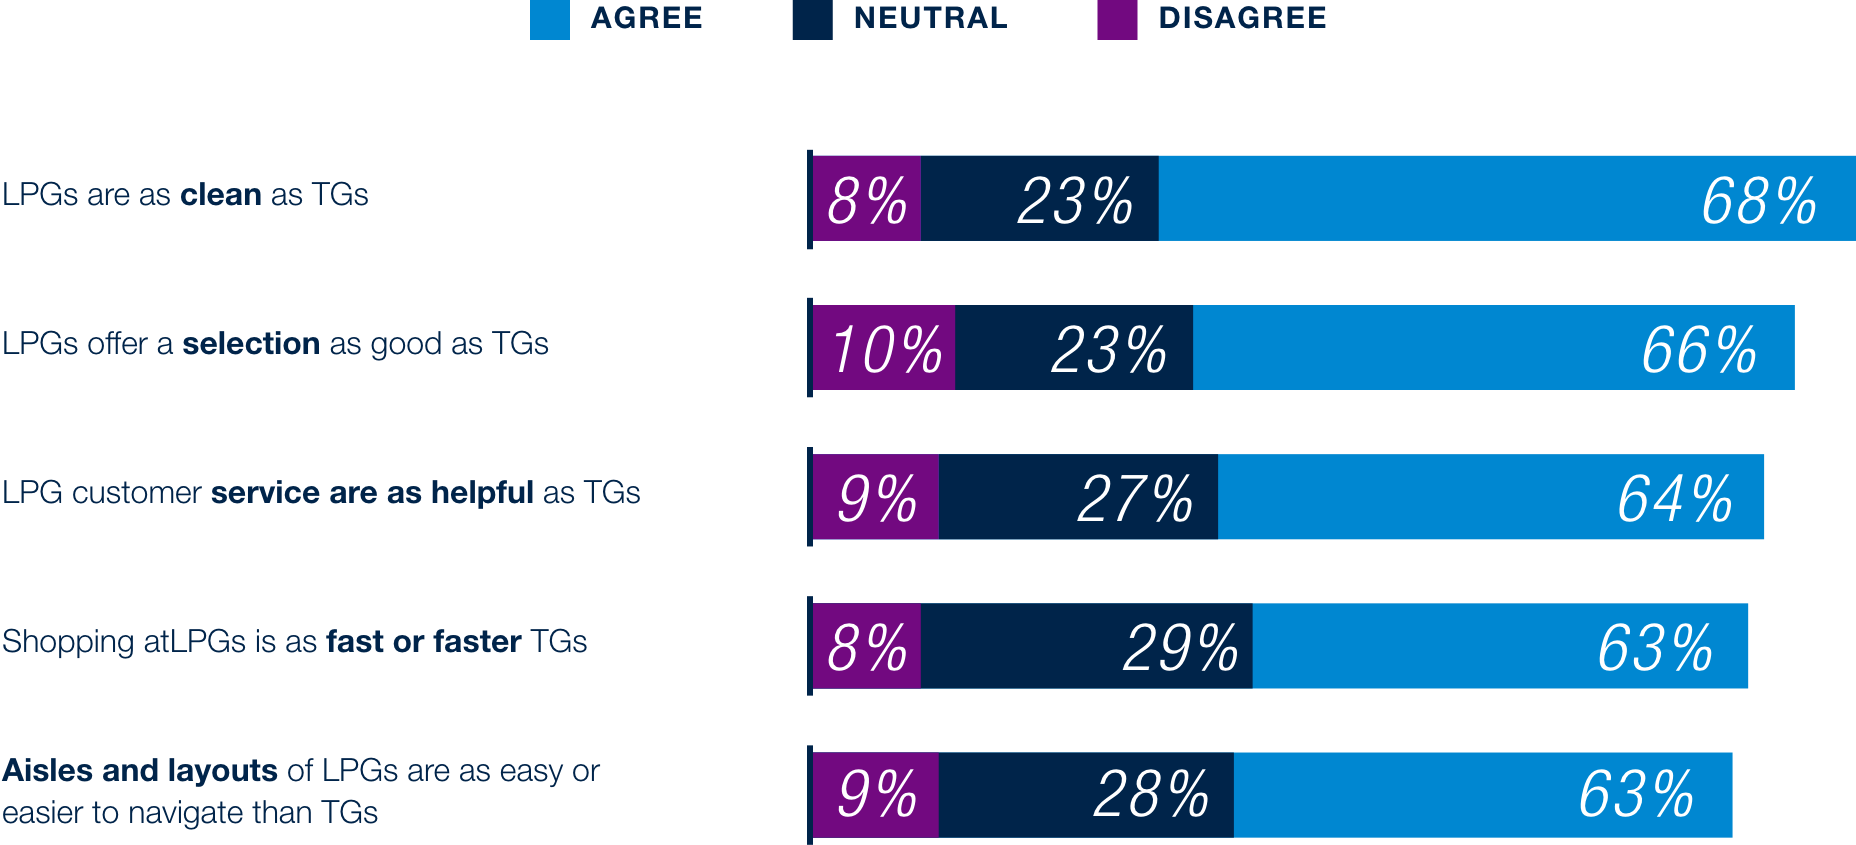
When comparing lower-priced outlets to traditional grocery stores, two-thirds of consumers state that the quality and assortments are comparable between the two store types. This sentiment highlights that price is not the only driver for lower-cost stores, but that quality and optionality expectations are also highly valued by consumers.
Consumer Perception of Lower Price Grocers (LPG) vs Traditional Grocers (TG)
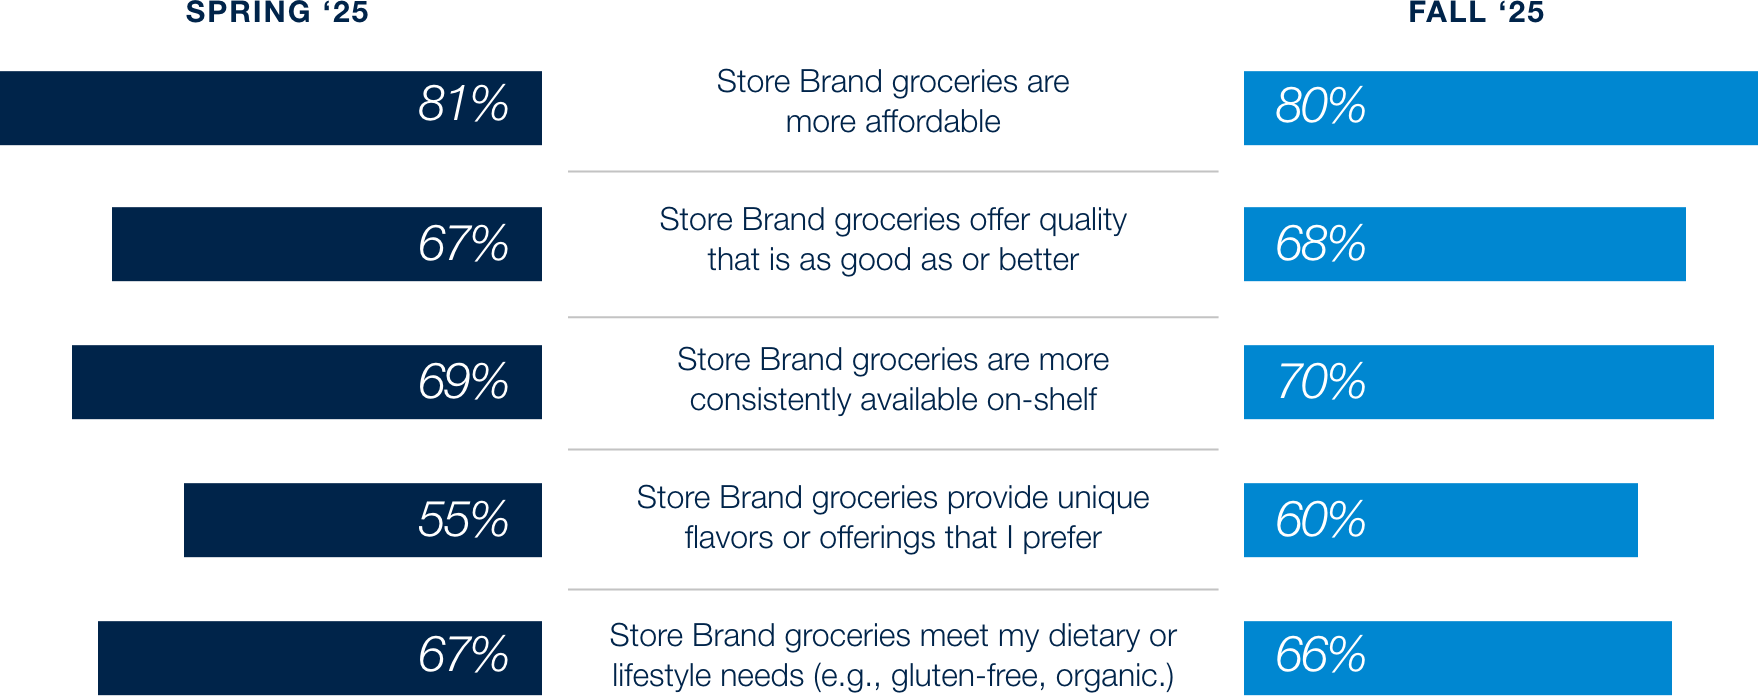
In addition to shifting towards lower-cost store alternatives, consumers continue to express positive feedback towards store-branded grocery items. Compared to last cycle, perceptions on quality and availability have increased slightly (net-more = 1%) while unique flavors and offerings have increased moderately (net-more = 5%), continuing to show that value is driven beyond price, but also by quality and taste of the products.
Consumer Perceptions of Store Brand vs National Brand Groceries
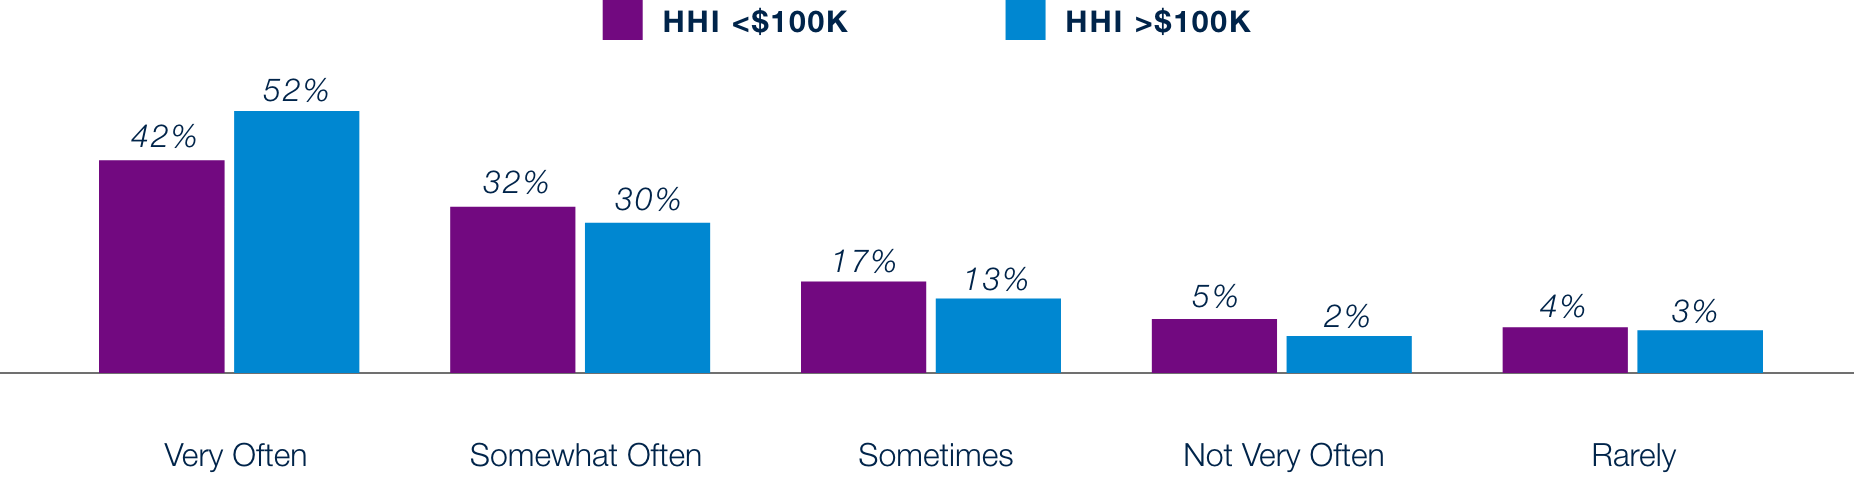
With improvements made in private label products, consumers with above HHI are signaling a shift towards these products. 82% of consumers with HHI of $100k+ have increased their frequency of purchasing private-label products, aligning with improved quality as a value driver for private label growth.
Frequency of Buying Store-Brand Products in Grocery Stores
Restaurants
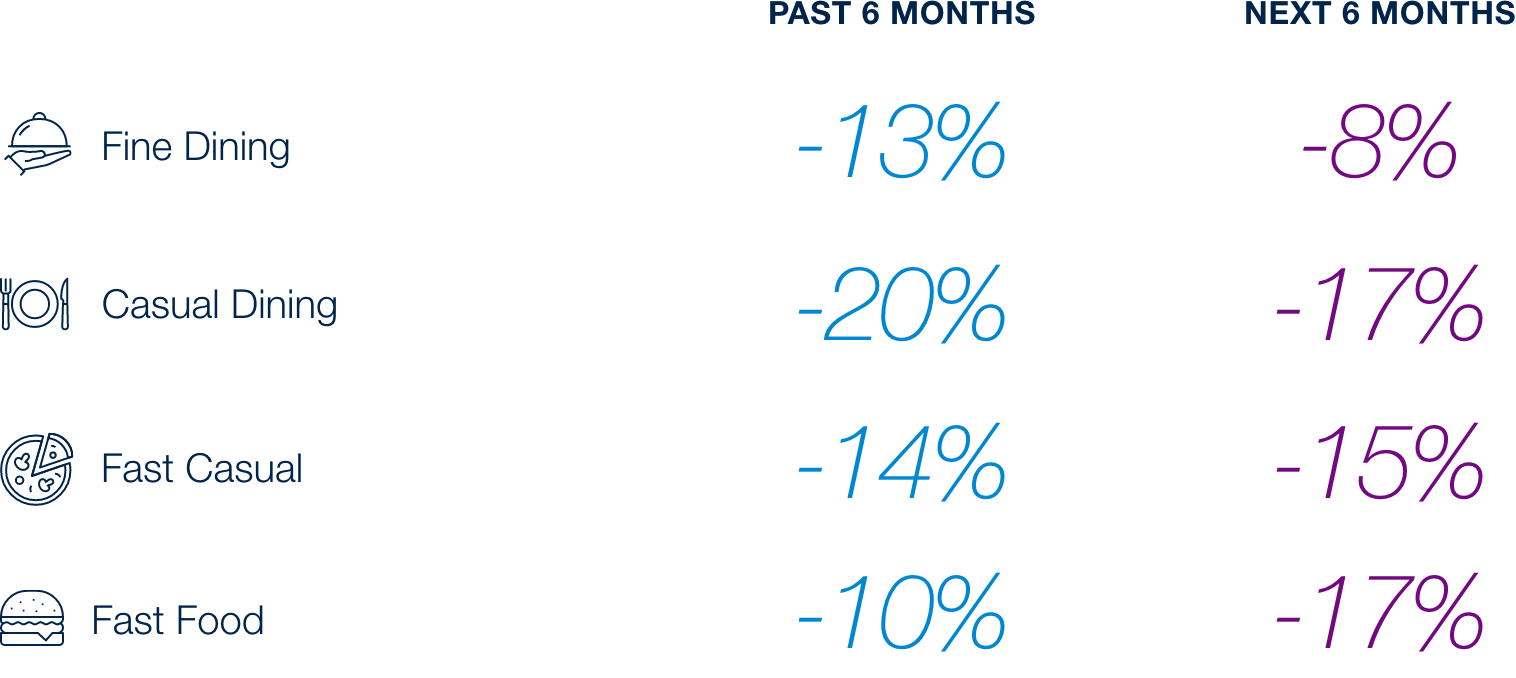
When it comes to restaurants, 52% of consumers have cited reduced consumption in the past 6 months while 43% state that they anticipate reducing spend in the next 6 months. Moreover, the spending at restaurants is affecting all formats, with Fast Food and Fast Casual feeling the pinch most acutely despite being the lowest cost offerings. This trend reflects that consumers are not only prioritizing price with their dining options, but also other aspects such as the dining experience.
How Has Spending at Restaurants Changed and Will Change
(Net-More)
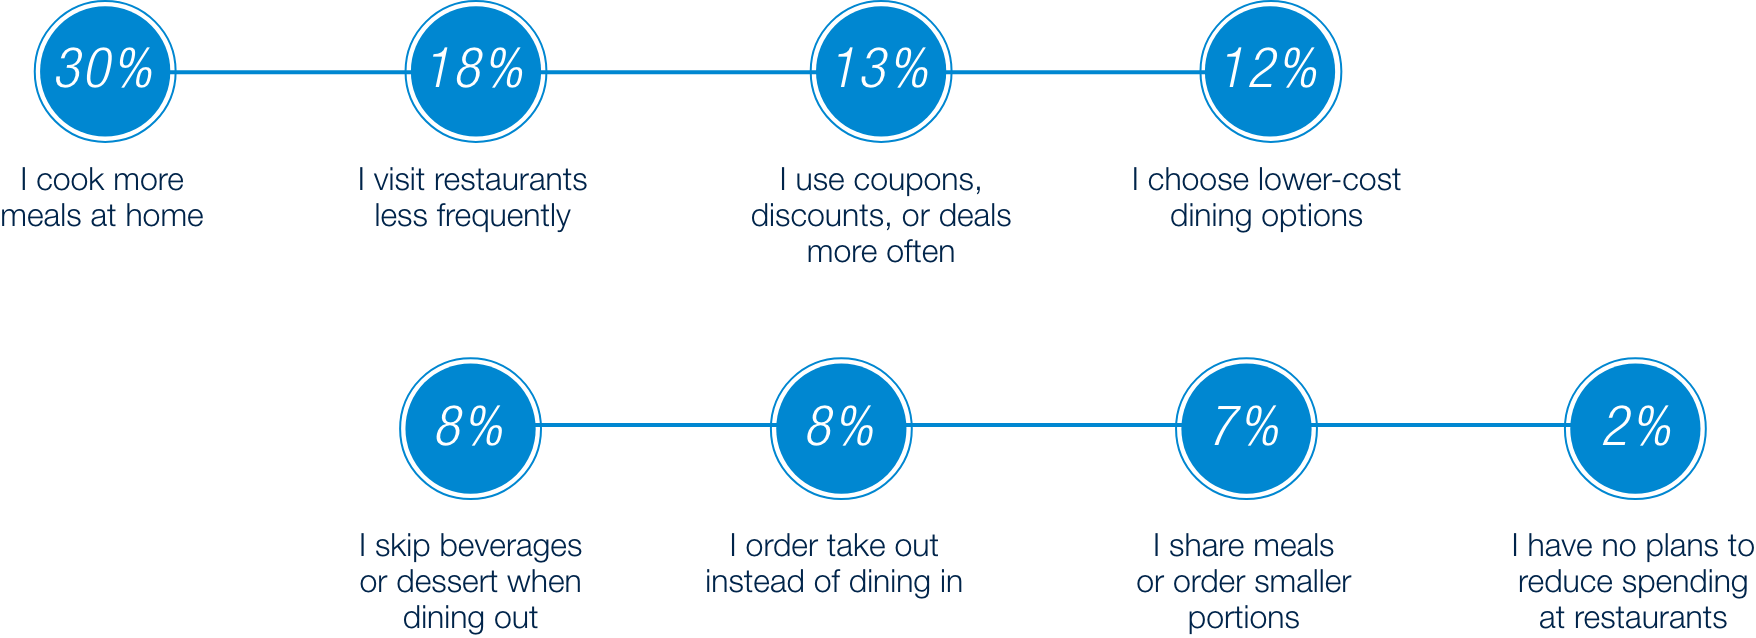
While consumers are reducing their spending at restaurants, there appears to be correlation to grocery activity in the market. 30% of consumers cite preparing meals at home as a viable replacement, which directly influences their behavior when it comes to grocery shopping. Additionally, consumers continue to use tested methods such as less frequent visits and available deals to cut back on their restaurant spending.
How to Cut Back on Restaurants
Driving long-term customer loyalty
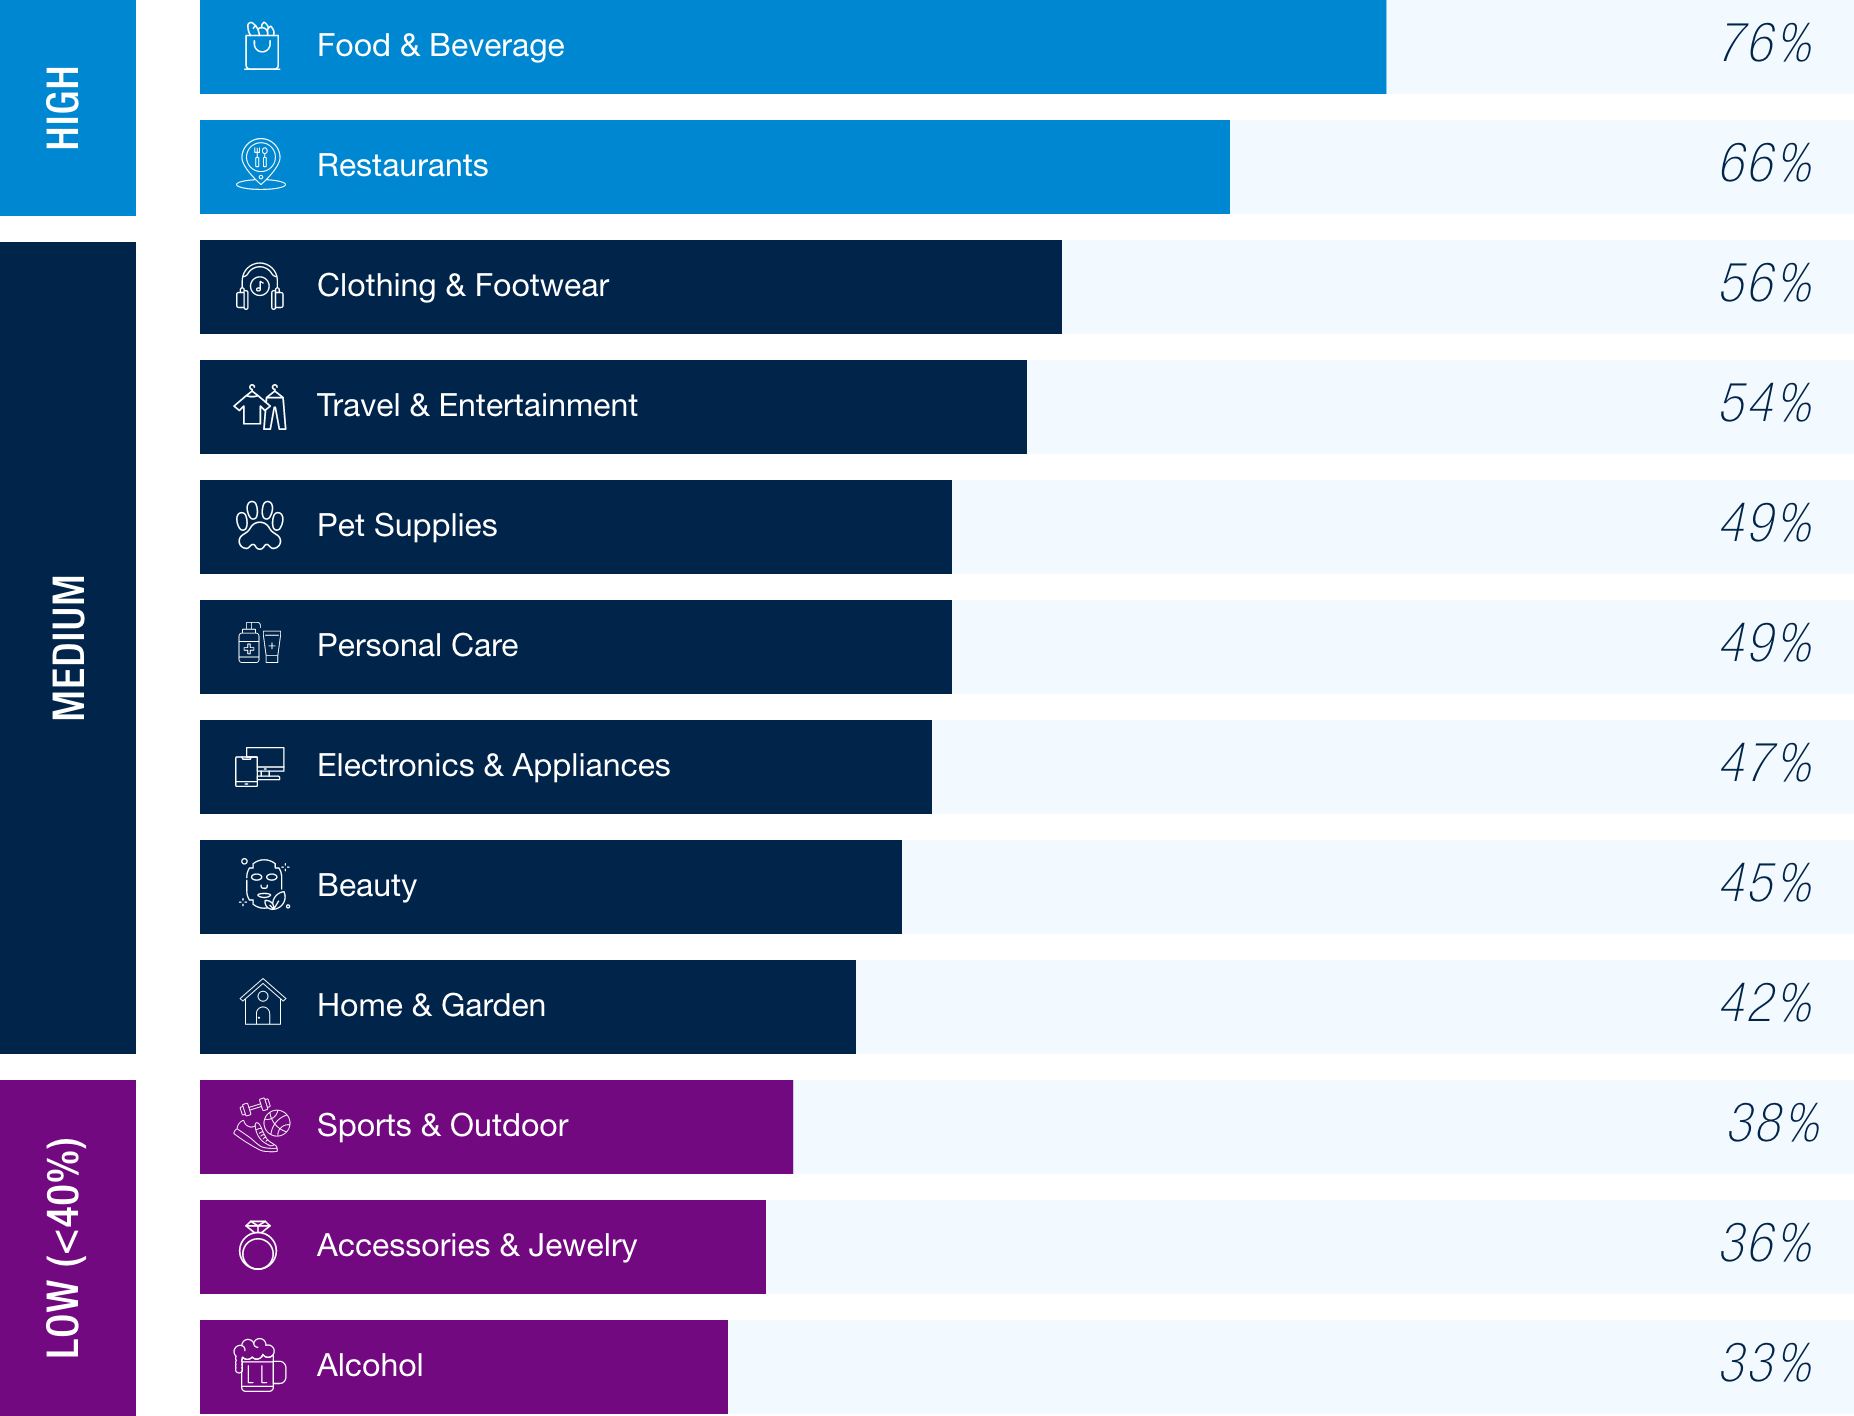
As customers increasingly prioritize value, loyalty behaviors toward brands and retailers have become less consistent–making it essential for retailers to build loyalty programs that deliver value to consumers. All categories saw an increase in participation compared to Spring ’25, signaling that programs are now a baseline expectation in many categories. Engagement is strongest in food & beverage (76%) and restaurants (66%), where frequent purchases and everyday value make programs especially relevant. Mid-tier categories like travel & entertainment (56%), personal care (49%), and electronics & appliances (47%) see solid adoption, reflecting the role of rewards in offsetting larger or recurring expenses.
In contrast, categories such as sports & outdoor (38%), accessories & jewelry (36%), and alcohol (33%) lag behind, suggesting loyalty initiatives in these spaces must go beyond simple discounts to capture attention. For retailers, the imperative is clear. To win lasting loyalty, programs must not only exist but deliver meaningful, differentiated value where consumers are most engaged.
Loyalty Program Participation by Category
Exclusive perks (60%) and earning more points (58%) remain the top loyalty drivers overall. Older consumers (45–80) are more likely to value points (61%) and perks (57%), while younger consumers (18–44) lean more heavily on perks (69%) and are also more influenced by technology-driven convenience. Nearly half of younger shoppers (49%) say saved information for faster checkout encourages them to spend more, compared to 38% of older consumers. This generational split underscores that while perks and points are universal motivators, younger shoppers are far more responsive to tech-enabled features that simplify the shopping journey.
Loyalty Program Factors that Increase Spend by Age Group1
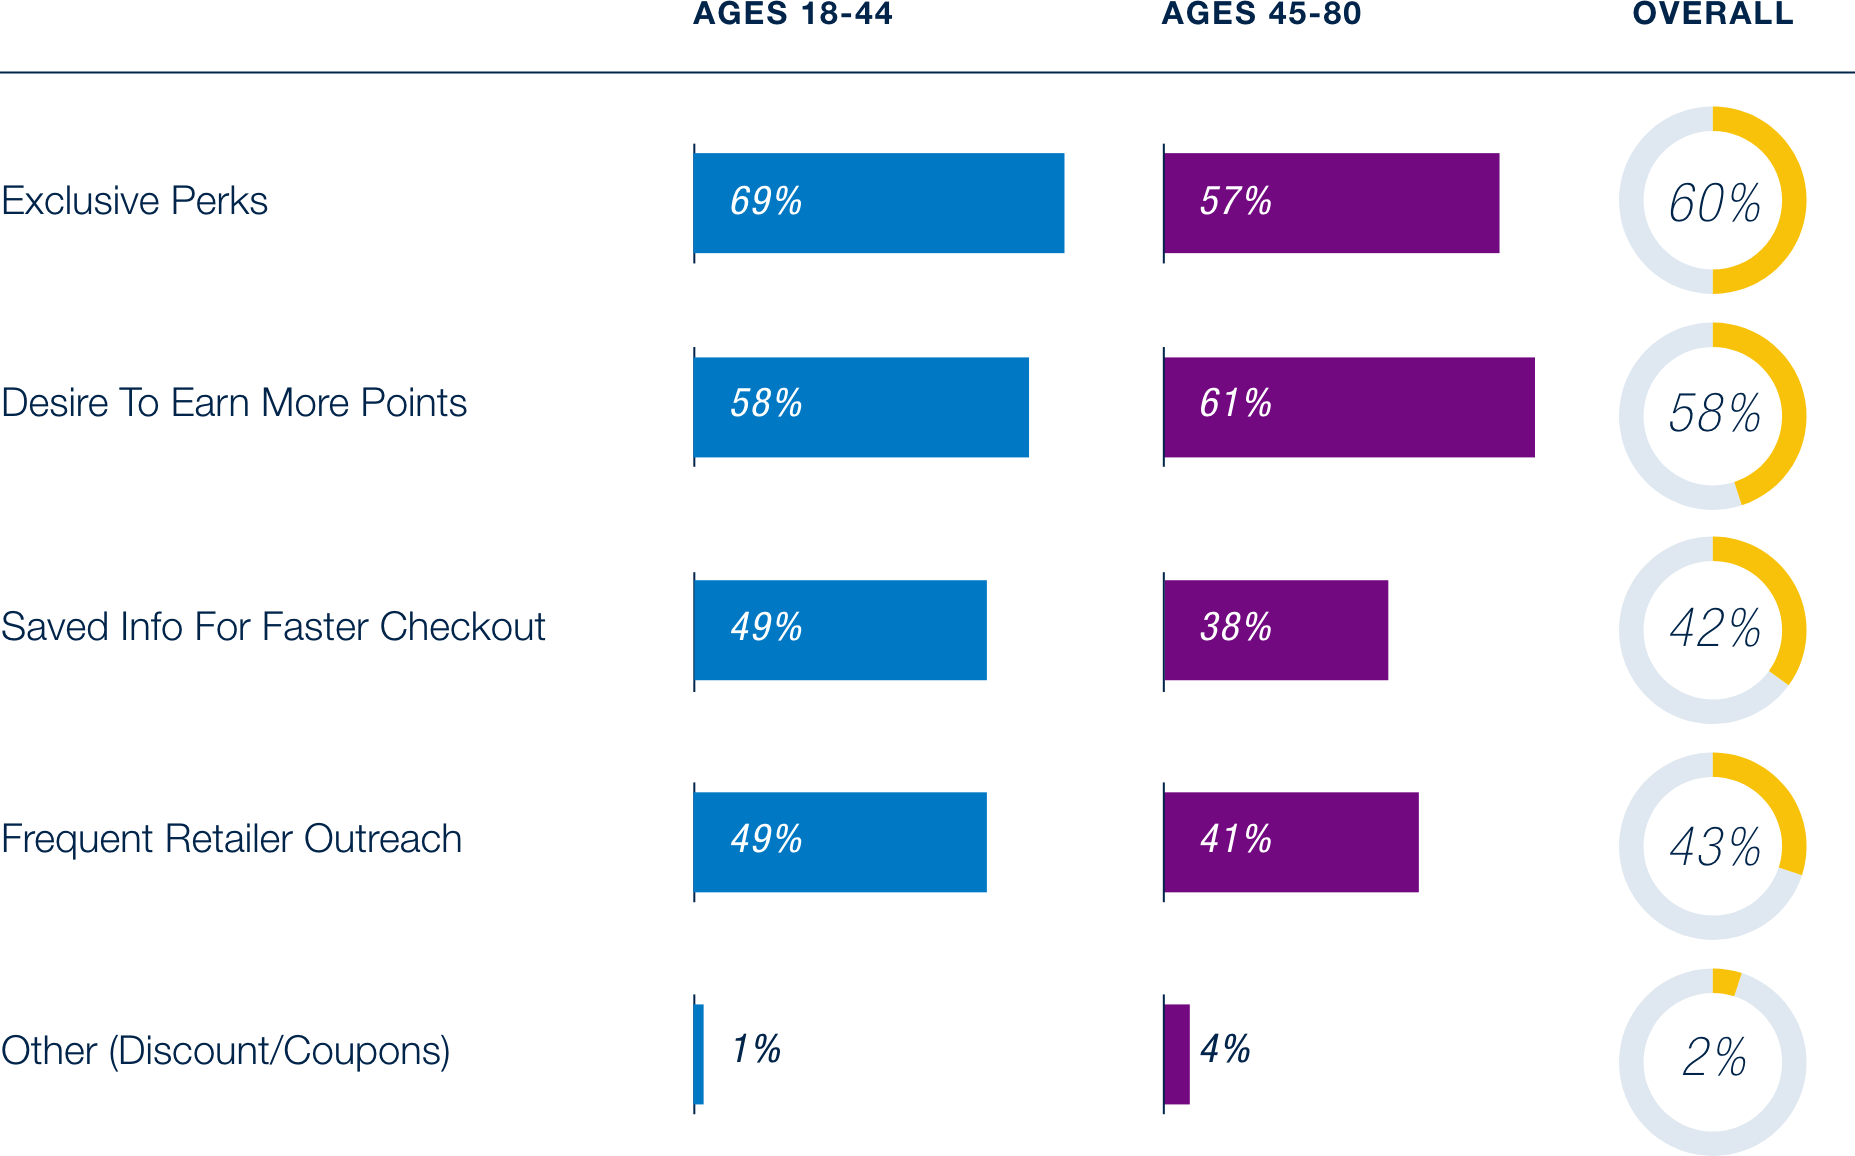
1 Data excludes individuals not enrolled in loyalty programs
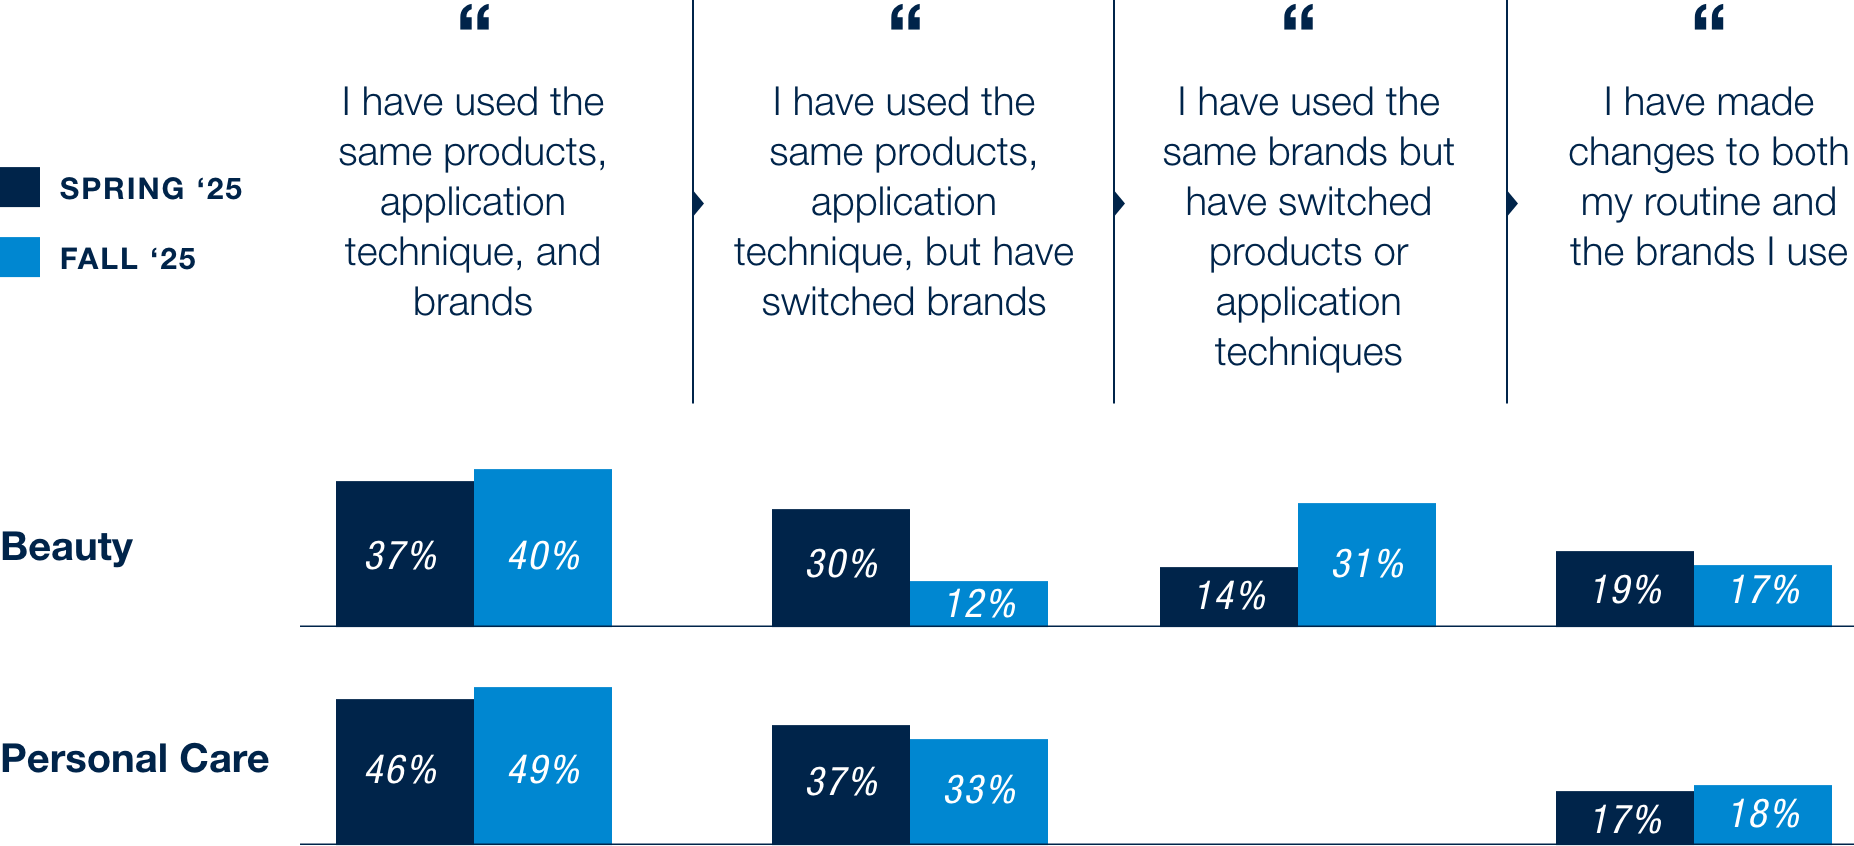
Over the past six months, consumers have shifted from switching brands to trying new products within the same brand, underscoring their search for value. This trend reflects how brands are expanding assortments to retain customers, aligning with the broader pattern of inconsistent loyalty behaviors—where shoppers are cautious about experimenting but still open to deeper engagement when value is delivered.
How Beauty / Personal Care Routines have Evolved over the Last Year
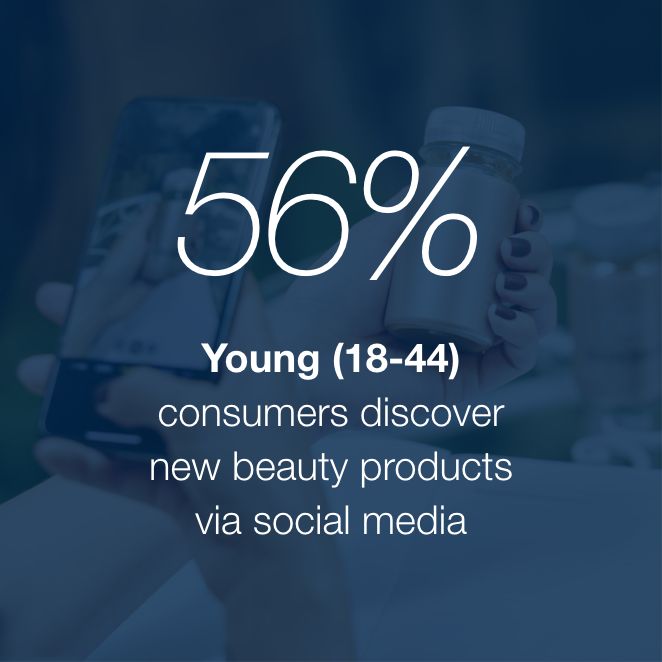
Social media continues to be the leading driver of product discovery and purchase in both beauty and personal care. Nearly half of respondents discover products through social platforms (47% for beauty, 42% for personal care), outpacing word-of-mouth from friends and family (38% for beauty, 40% for personal care). Both younger and older consumers have increased their use and reliance on social media to discover products (up to 56% and 37% among younger and older consumers, compared to 53% and 35% from the spring). These insights highlight the critical importance of robust, targeted digital engagement strategies across social channels.
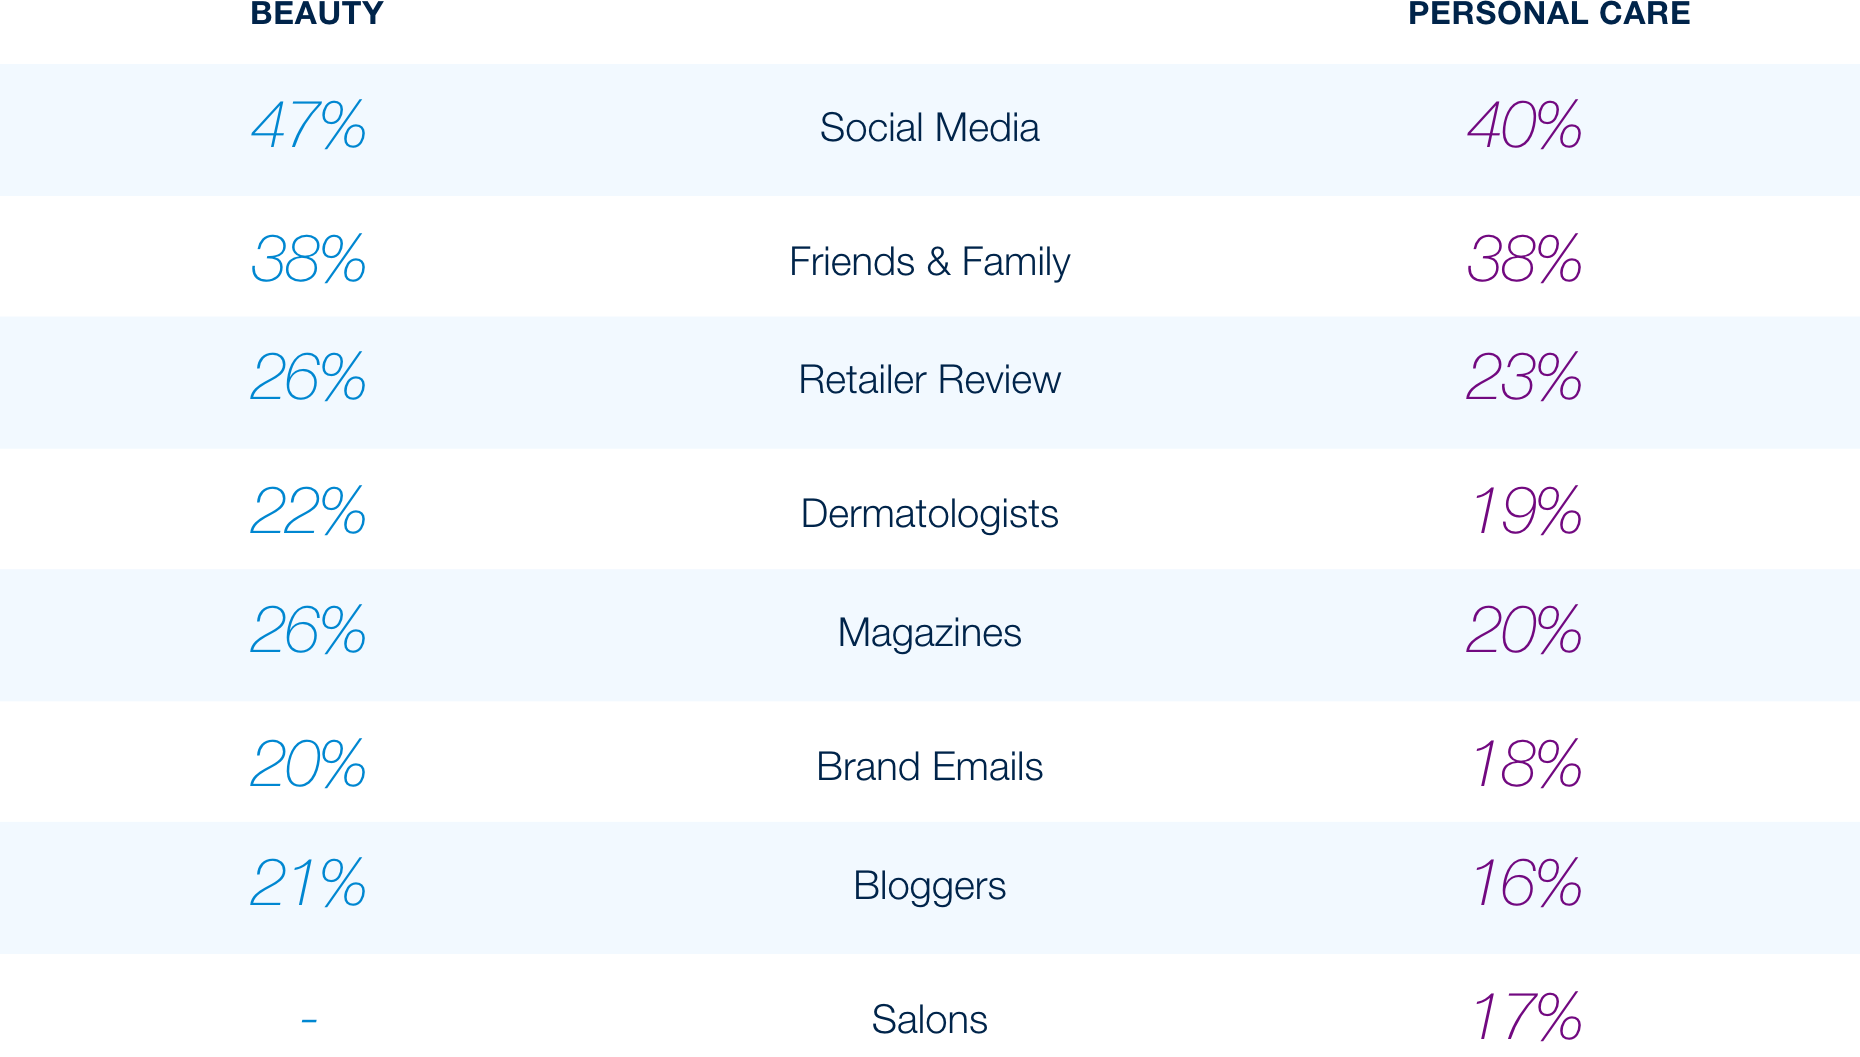
1 Salons not included as a response option for the beauty category
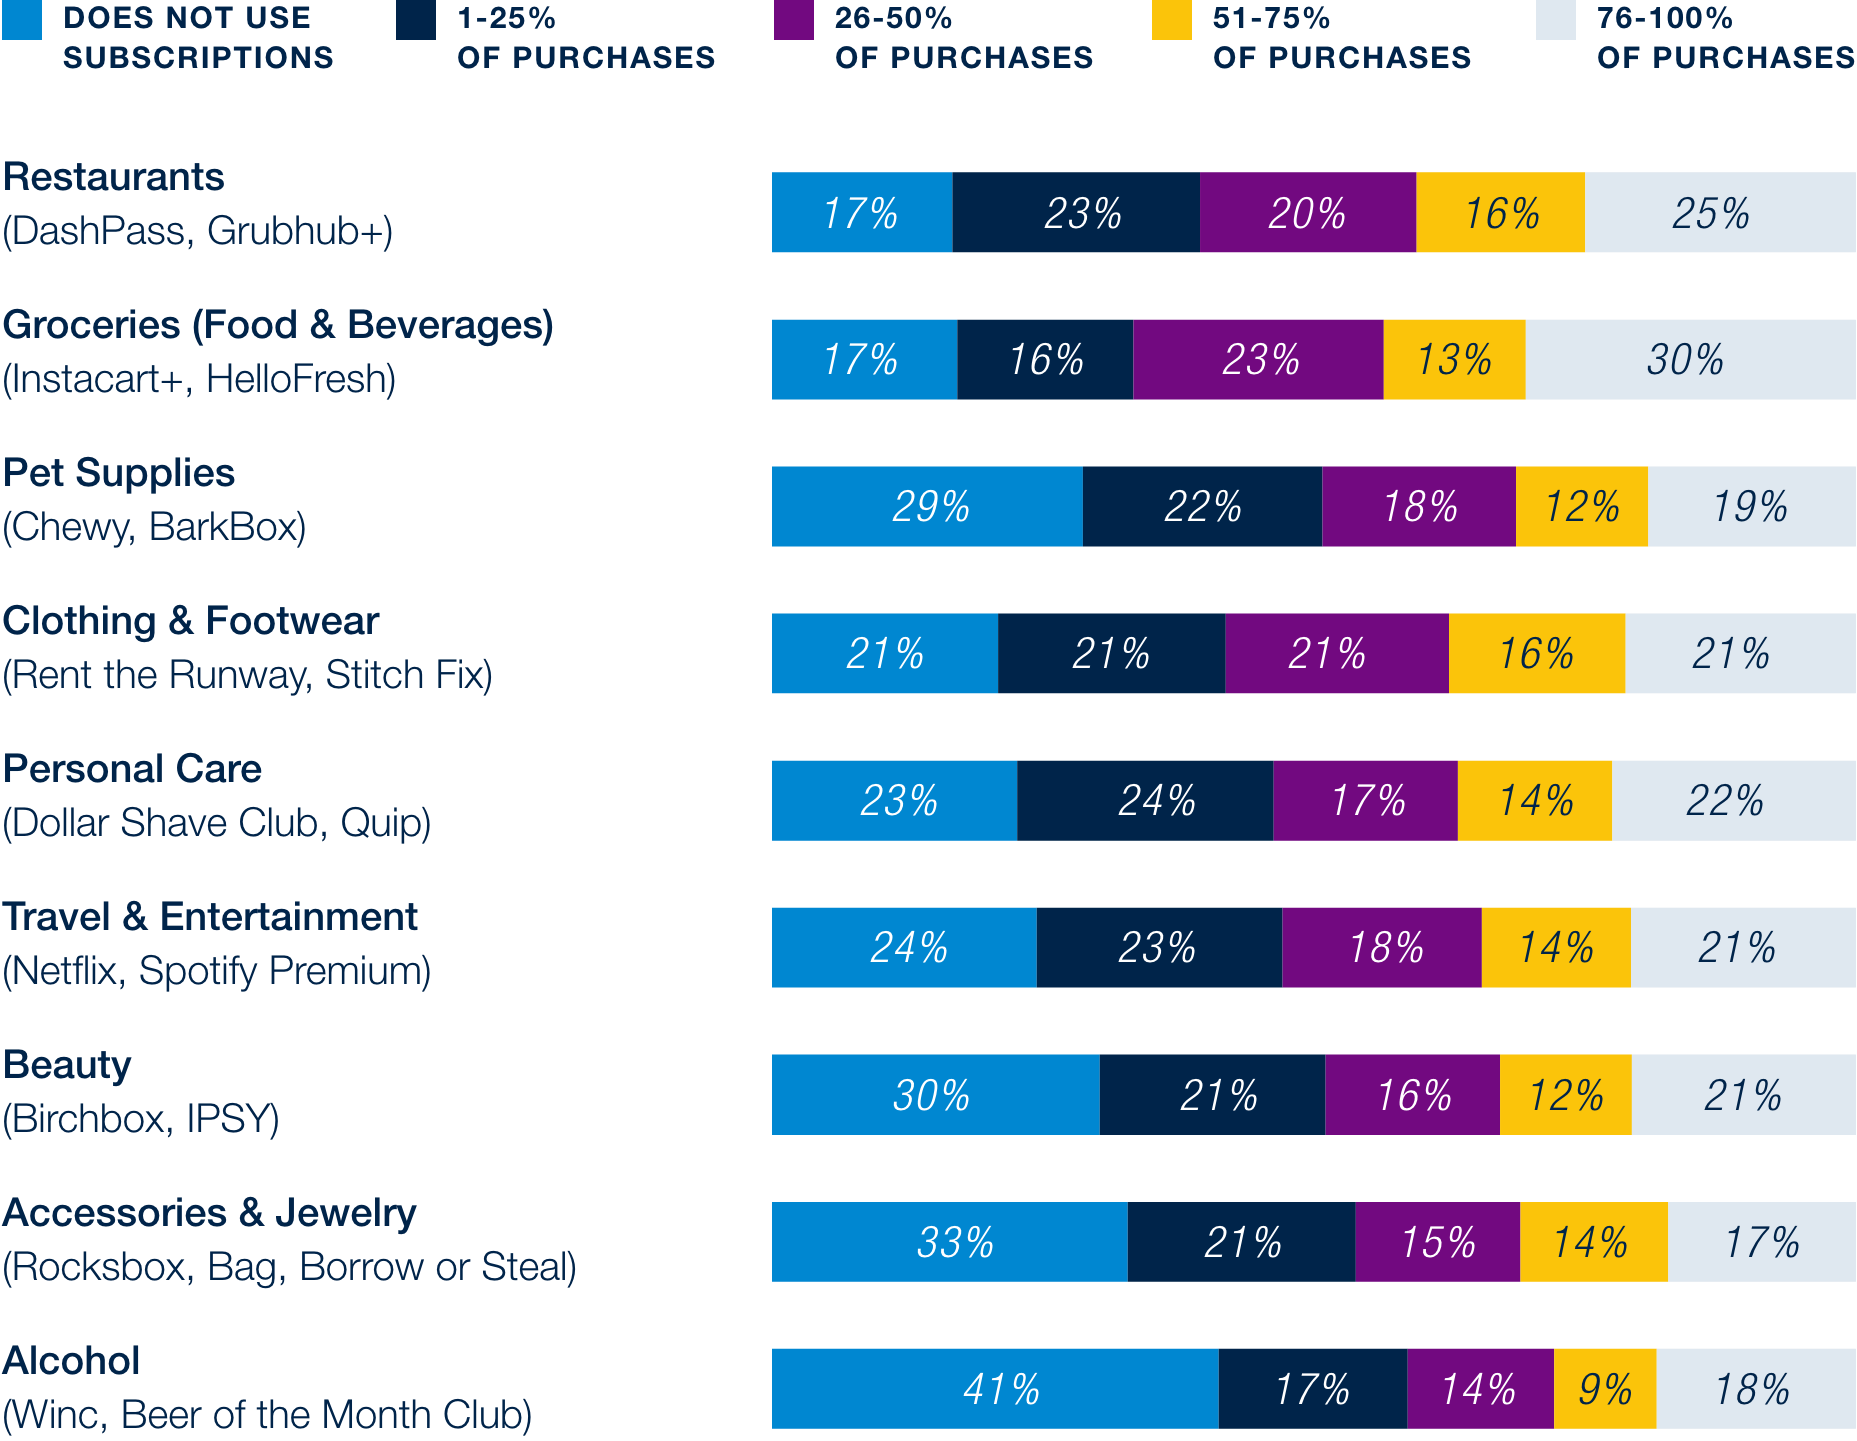
Subscription service models continue to play a meaningful role in how consumers shop and engage with retailers, with adoption spanning across categories and increasing from Spring ‘25. Restaurants and food & beverage subscriptions show the highest penetration, with nearly half of respondents using them for at least 50% of their purchases. Subscription usage is consistent in other categories as well, with steady adoption across pet supplies, clothing, personal care, travel and entertainment, and beauty.
Use of Subscription Services by Category – % of Purchases
Prioritizing Wellness
In alcohol and snacks, consumers are guided more by health considerations than by price, highlighting the growing influence of wellness on purchasing decisions.

Snacks
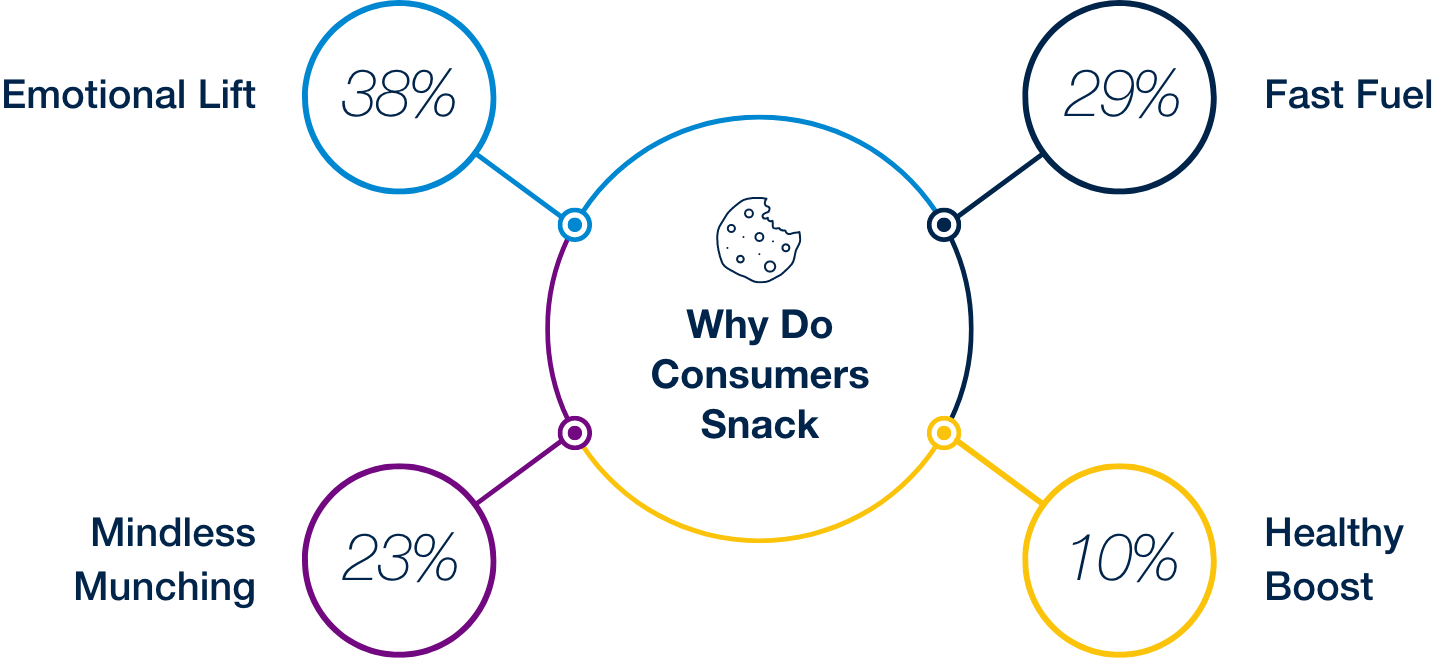
Broadly speaking, snacking is not tightening up as much as other consumer categories. About ~67% of respondents cited that their snacking patterns are snacking as often or more in the last 6 months. Underlying motivations are primarily driven by picking up emotional spirits and getting a quick burst of fuel. Additionally, consumers citing ‘Health Boost’ are most likely under-represented as foods such as fruit may not be considered as a snack in the traditional sense. These are intrinsic motivations that macroeconomic conditions do not have as much sway over, even though ~10% of consumers have reported reduced snacking due to lower spending power.
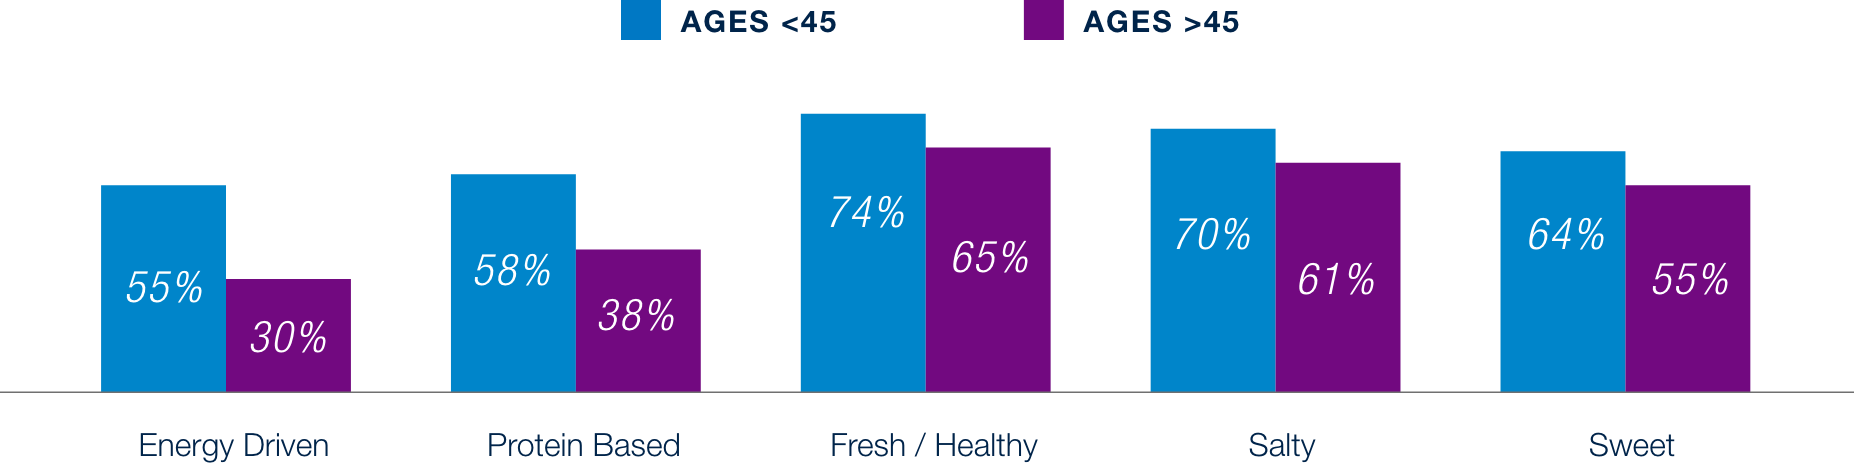
Beyond the intrinsic motivations for snacking, we are starting to see consumers gravitate towards more nutritious options. We see that younger consumers are consistently snacking more than older consumers, especially in categories that are more energy driven and protein based, where the difference is by 20 percentage points. This shift indicates how the presence of positive ingredients in snacks are appealing to consumers seeking options that can complement more healthy and active lifestyles.
Snacking Category for Frequent Snackers

Alcohol
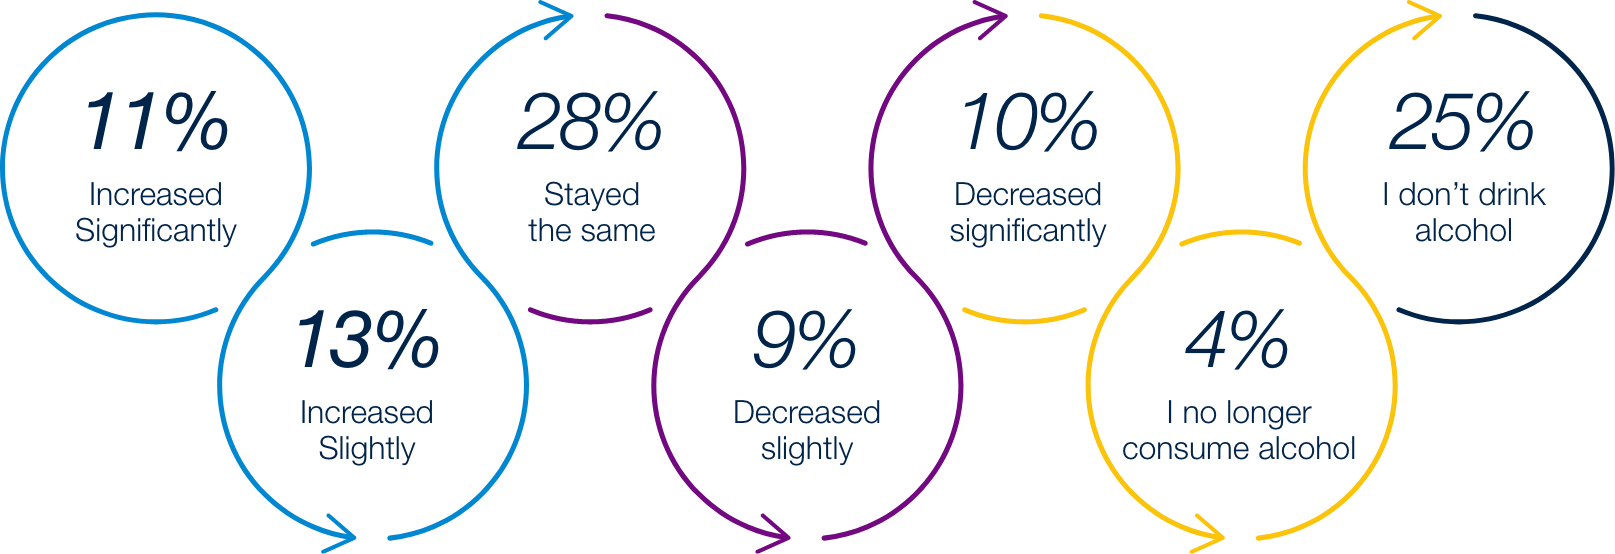
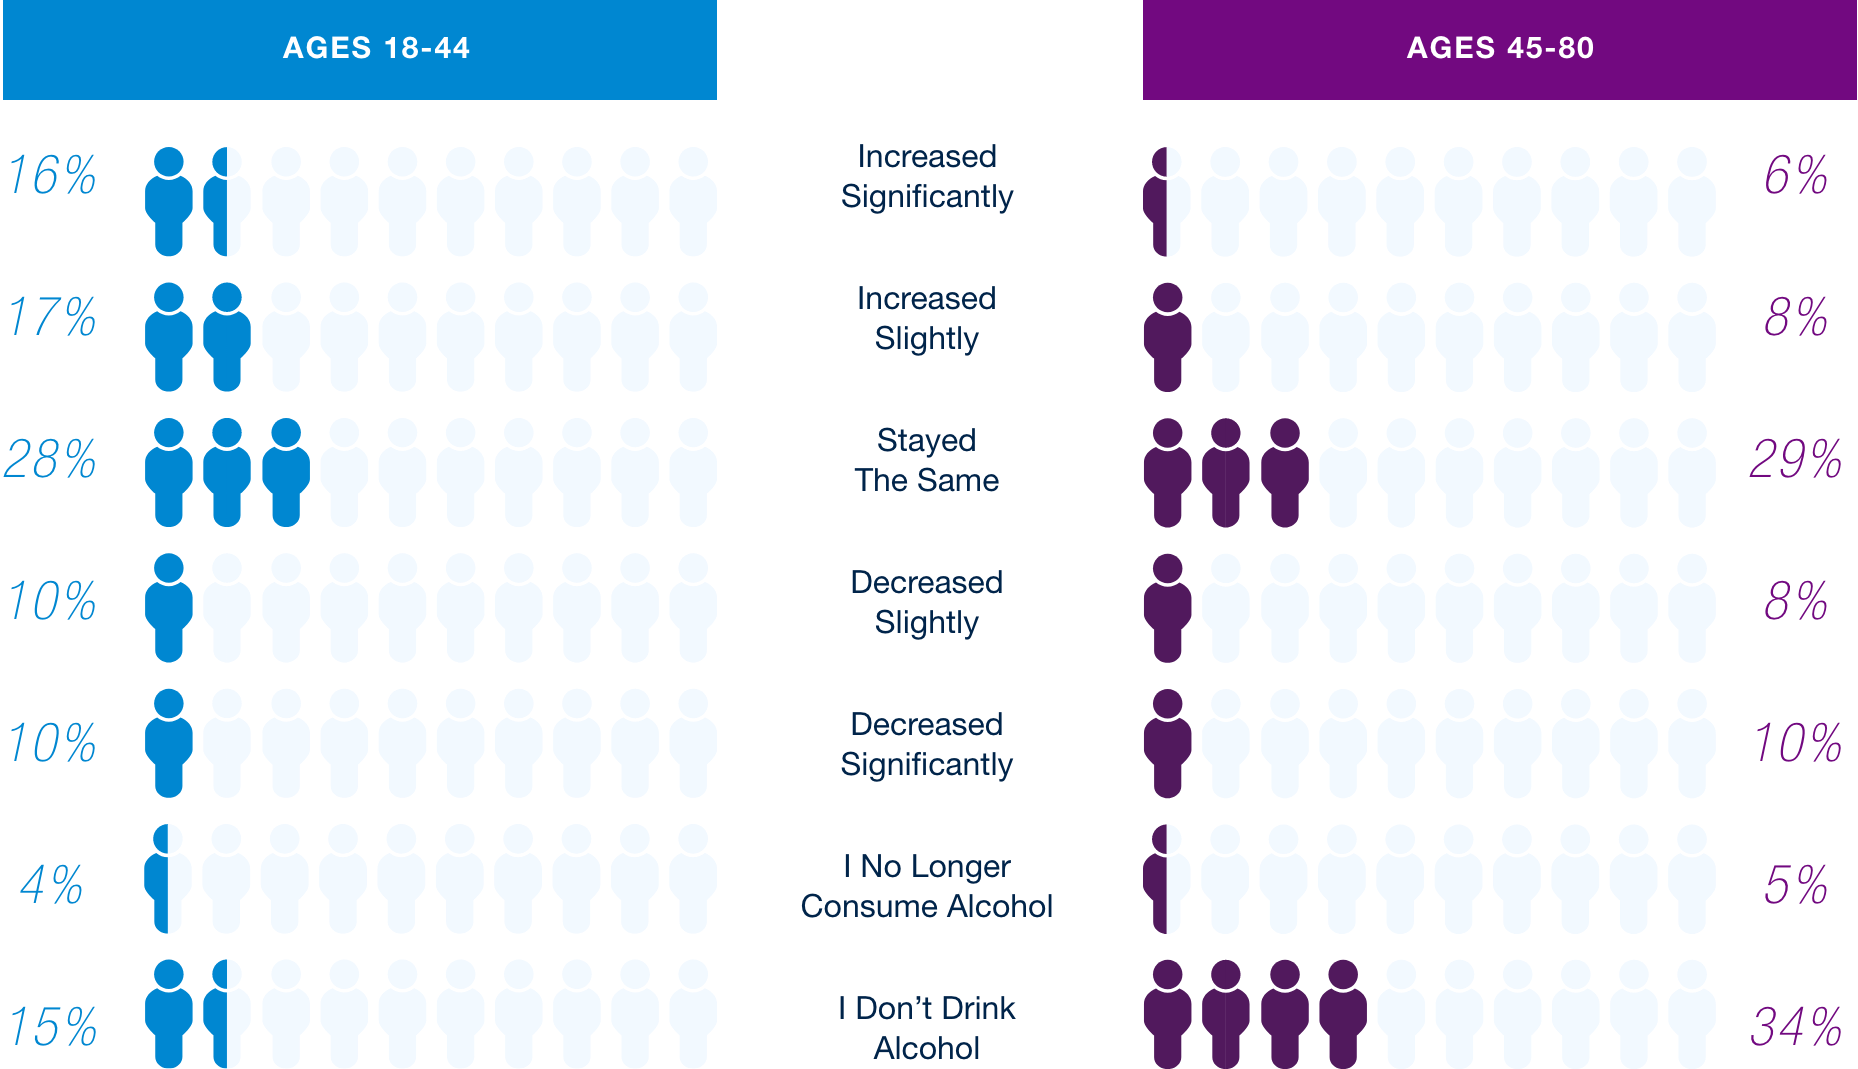
Nearly half of consumers (48%) report that they are either abstaining from alcohol entirely or planning to reduce their consumption over the next six months. This moderation trend looks different across age groups. Younger consumers (18–44) are the ones most likely to increase their alcohol intake, while older consumers (45–80) are driving the shift toward abstinence, with over one-third reporting they don’t drink at all. The data suggests that growth in alcohol consumption is concentrated among younger demographics, while older consumers are stepping away from drinking altogether.
Consumers’ Plans to Consume Alcohol Over the Next 6 Months
Reasons for Consumers Changing Their Alcohol Consumption
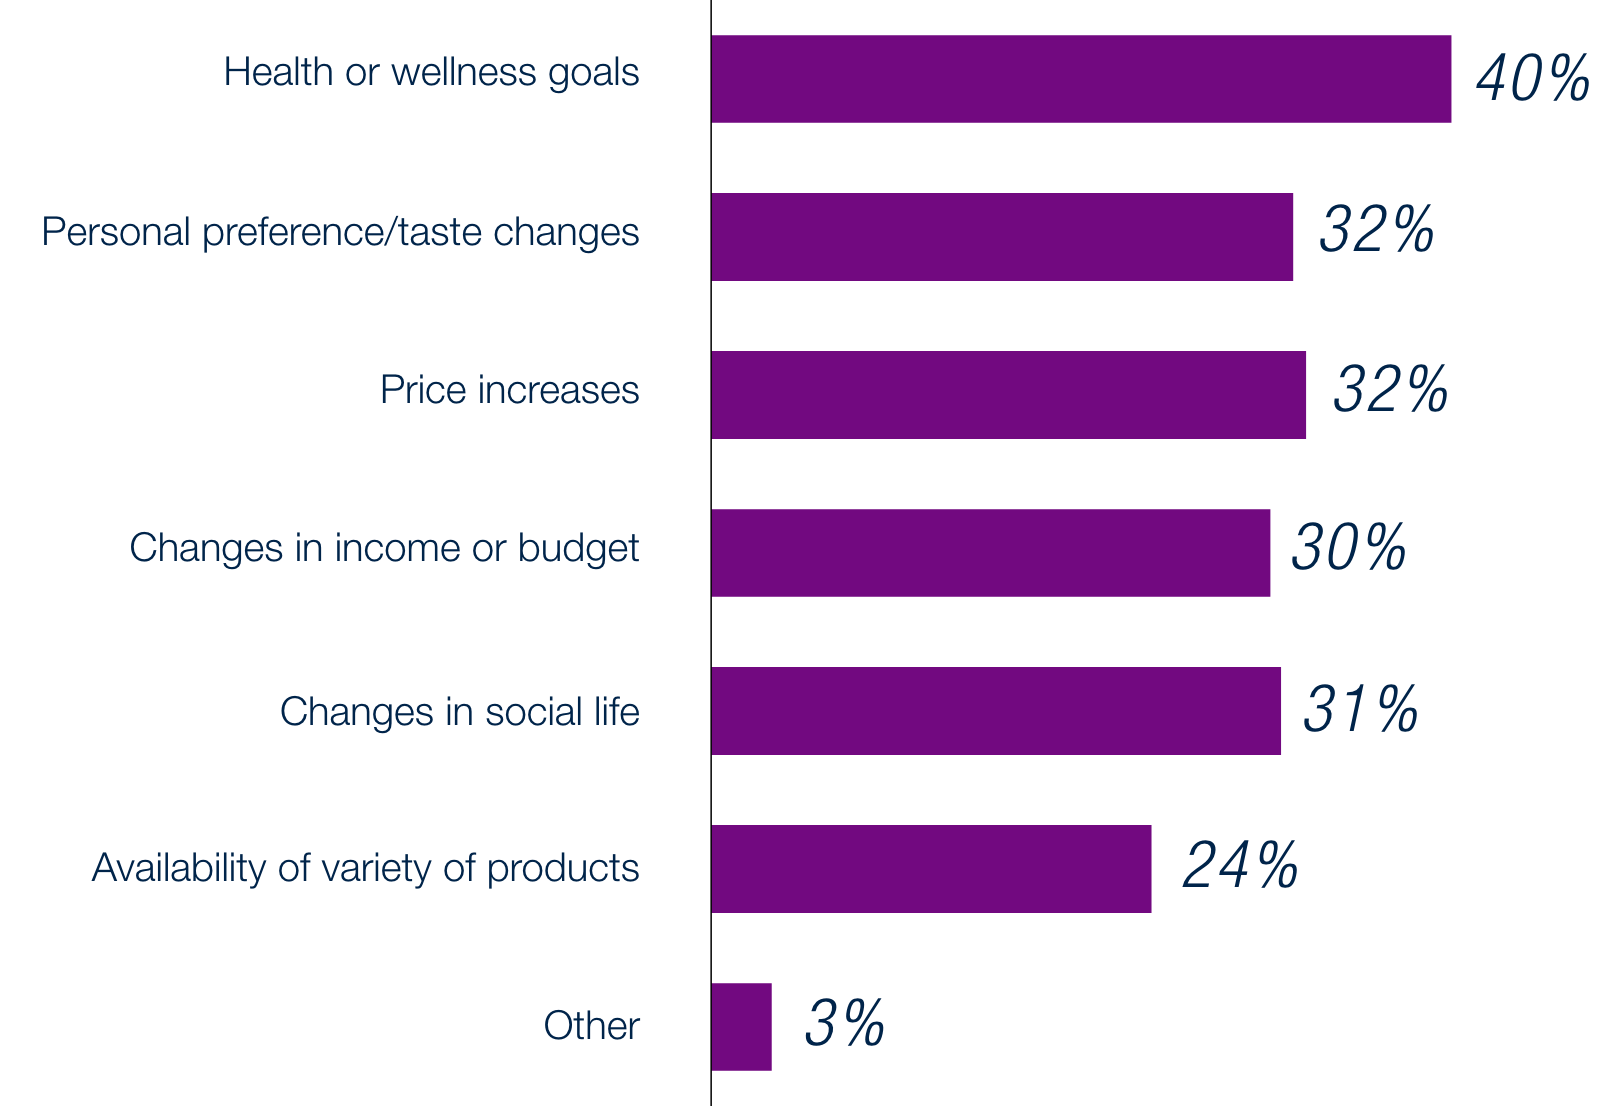
Unlike many other categories where price is the leading driver of behavior change, alcohol consumption stands out. Here, consumers are primarily motivated by health and wellness goals (40%), with cost considerations like price increases (32%) and budget constraints (30%) taking a back seat. This highlights how deeply personal and lifestyle-driven decisions around alcohol are, with wellness emerging as the top factor shaping consumption habits.
Holiday Shopping
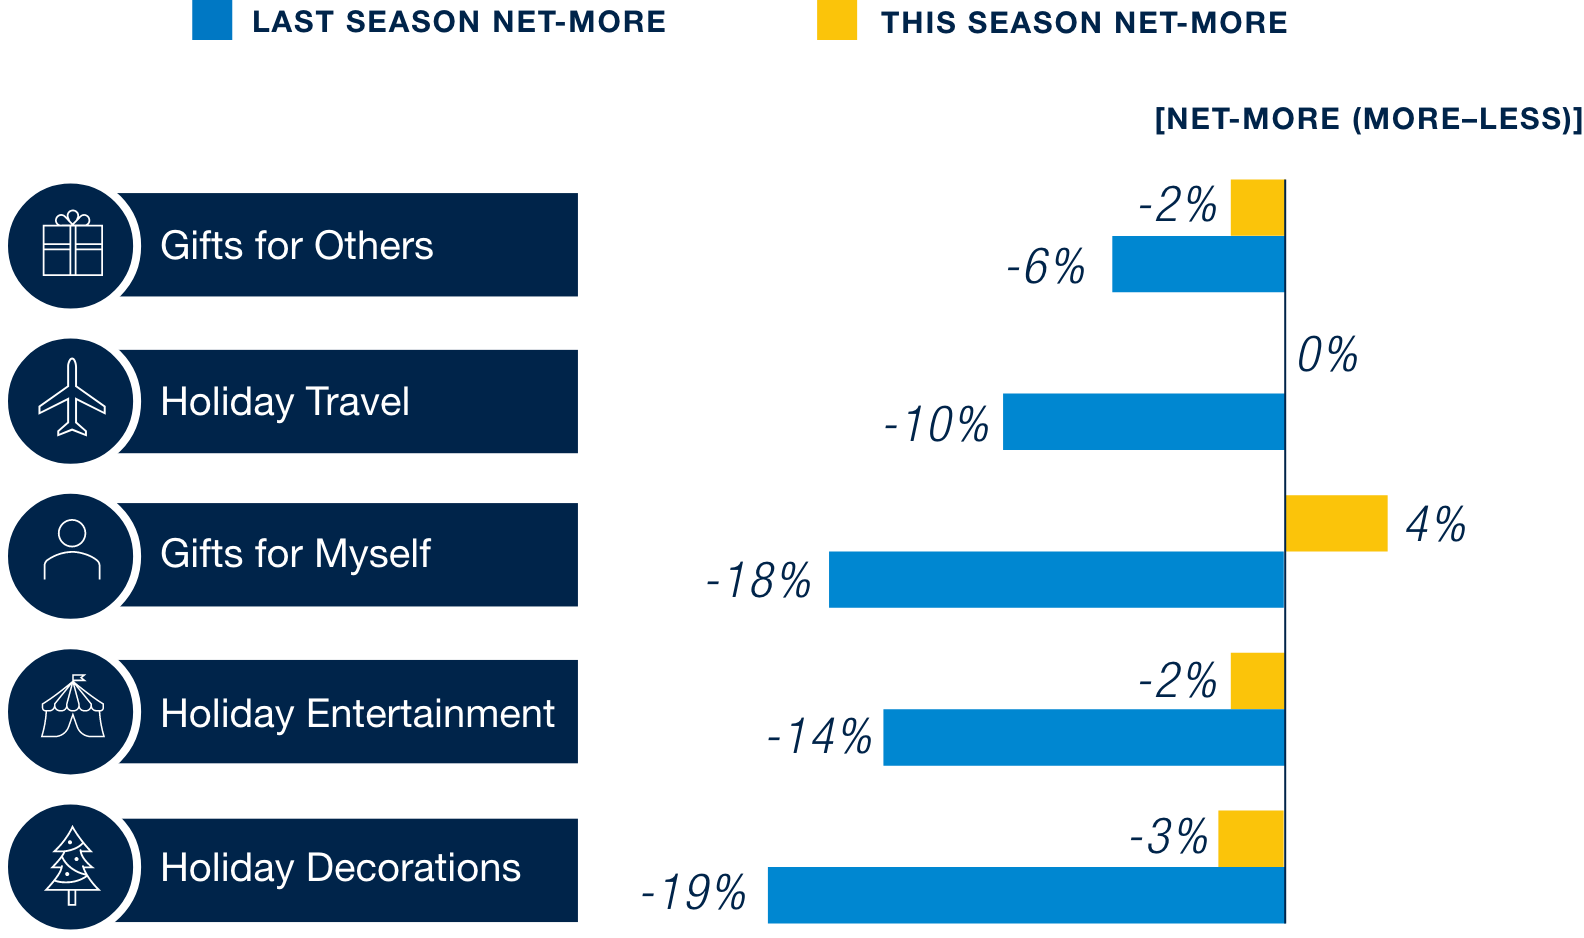
As we approach the holiday season, cautious spending continues to shape consumer behavior. Households plan to spend the same net amount this compared to last year—reflecting the sustained impact of tariffs on holiday-centric products. Holiday decorations continues to experience the largest cut-back (-3% net more) from last season. On the other hand, consumers are more willing to spend on gifts for themselves this holiday season (4% net more) compared to last cycle (-18% net more).

Plans To Spend This Holiday Season
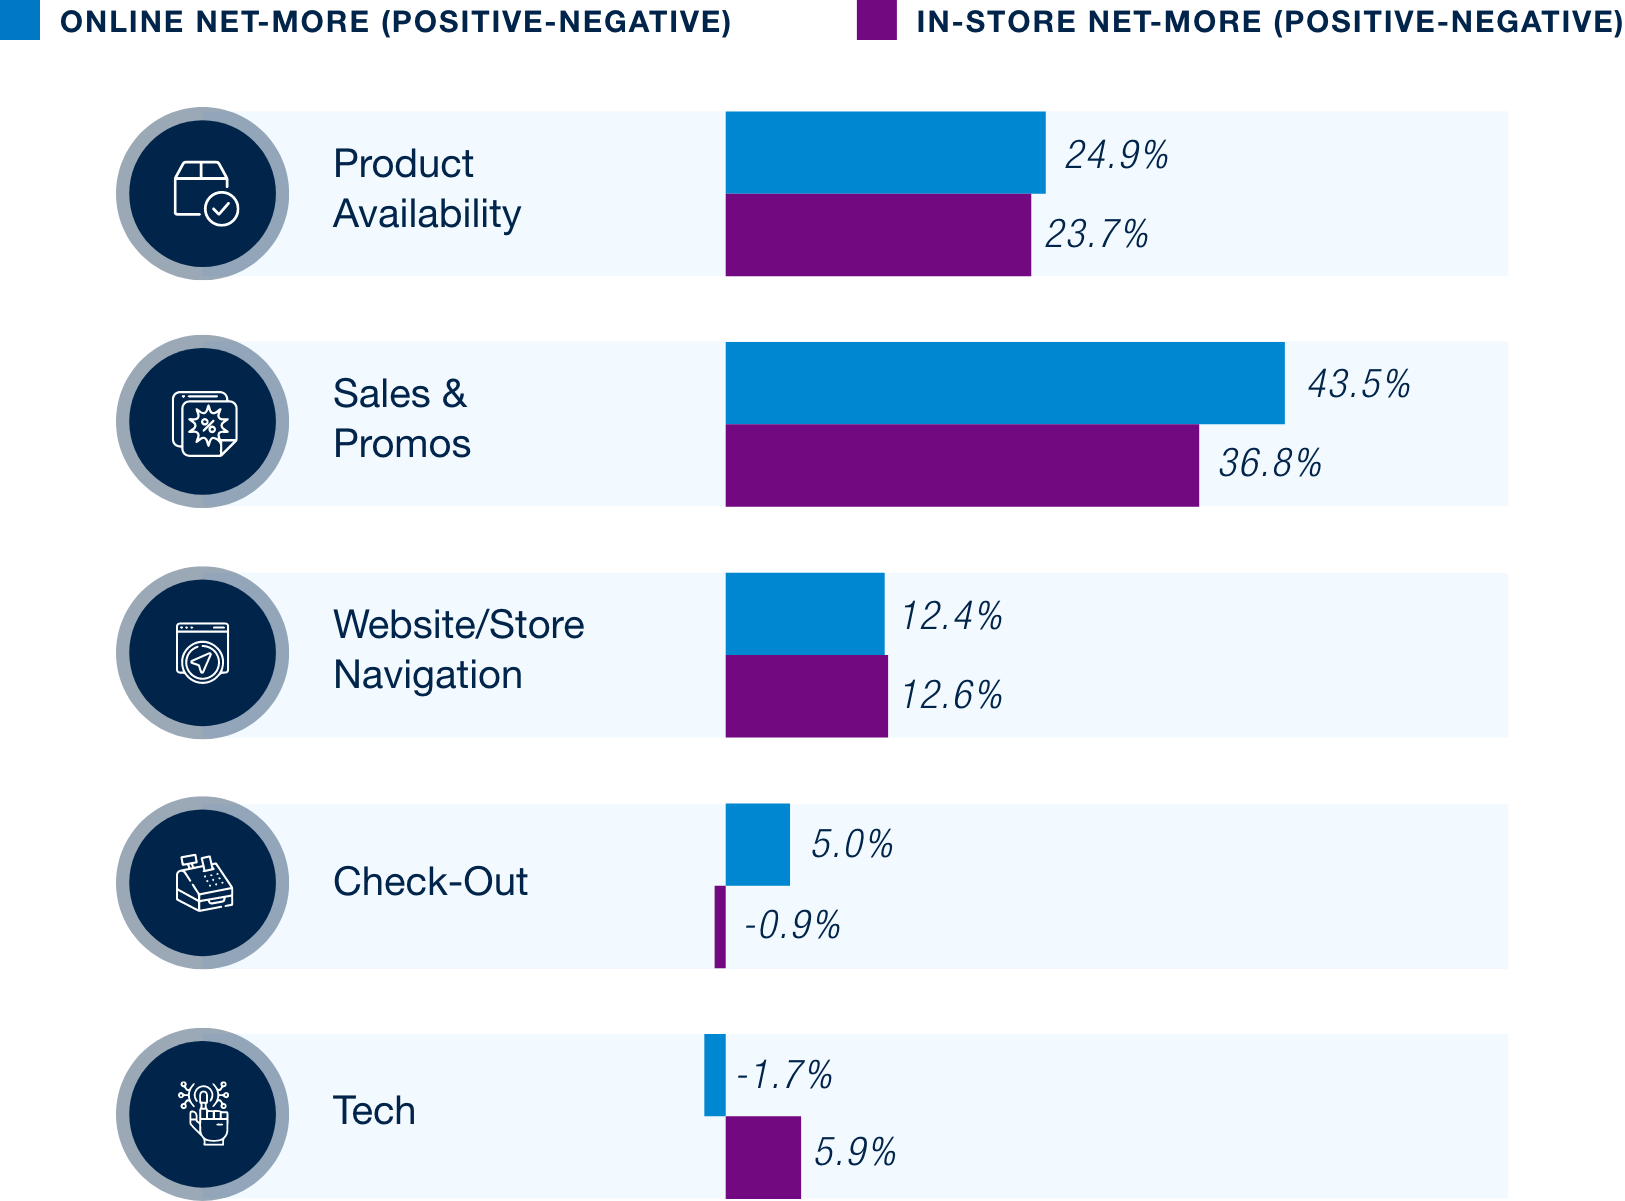
We’ve consistently seen that consumers prefer online shopping during the holiday season. When trying to identify which parts of the in-store vs online shopping experience were swaying customers to choose online shopping, sales & promotions offered online along with checkout were superior to those provided in stores by 700 and 600 basis points, respectively. However, customers continue to value in-store shopping for the ability to try products and is a better experience than virtual ‘try on’ technology that online shoppers use. This suggests that customers continue to enjoy omni-channel experiences that combine the strengths of physical and online commerce platforms.
Holiday Favorable Experience (Online Shoppers vs. In-Store Shoppers)
Holiday Gift- Giving Trends
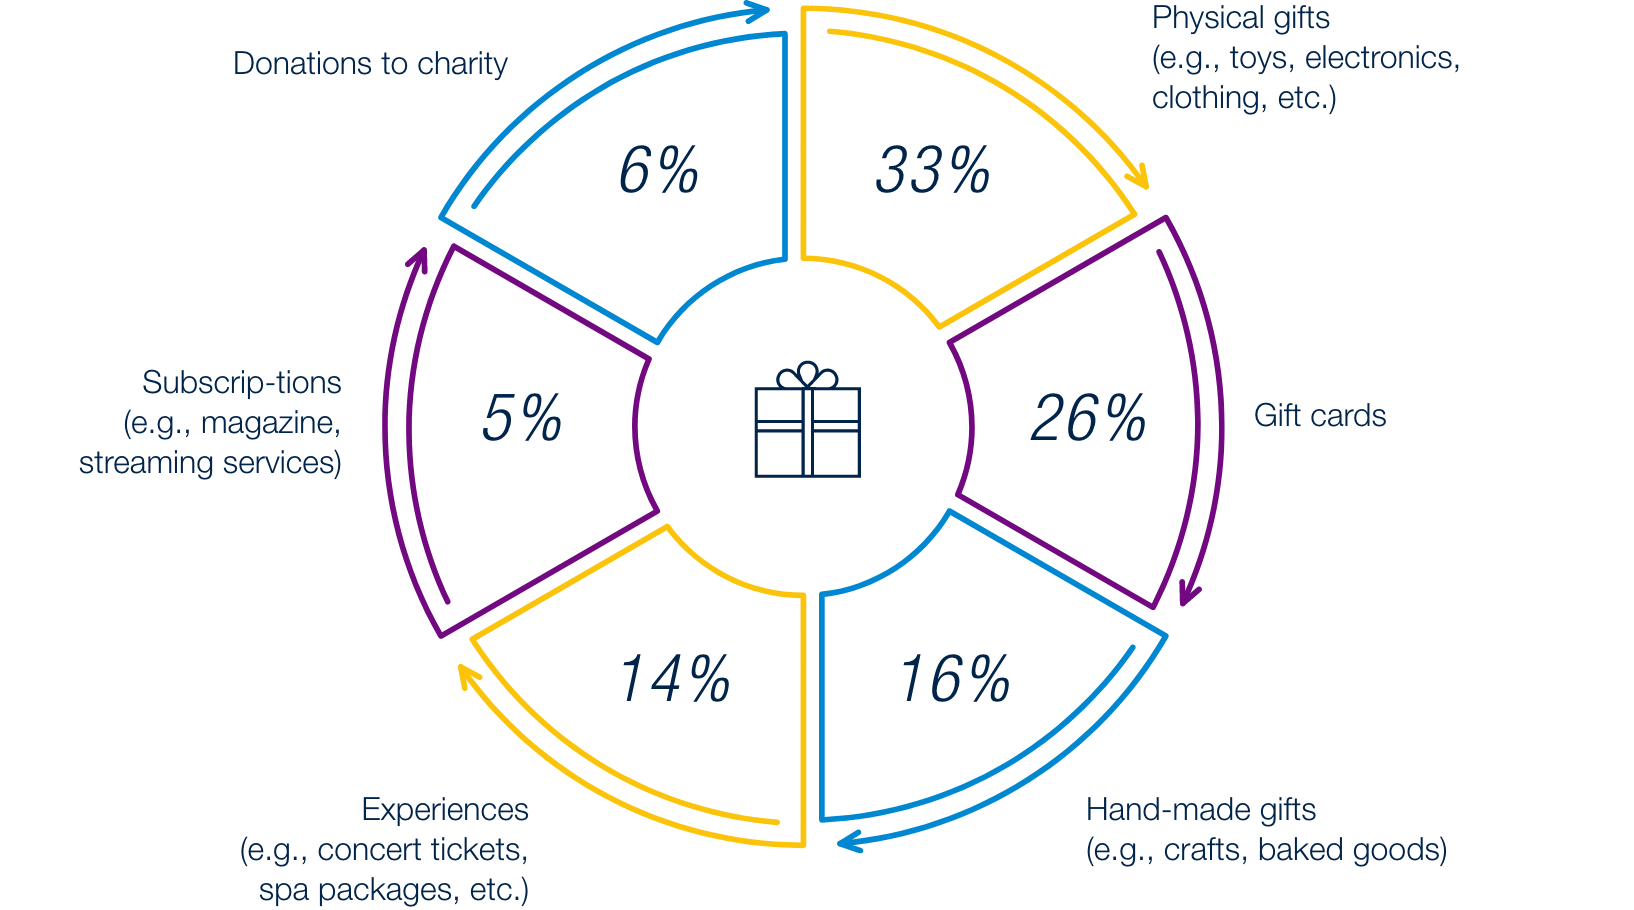
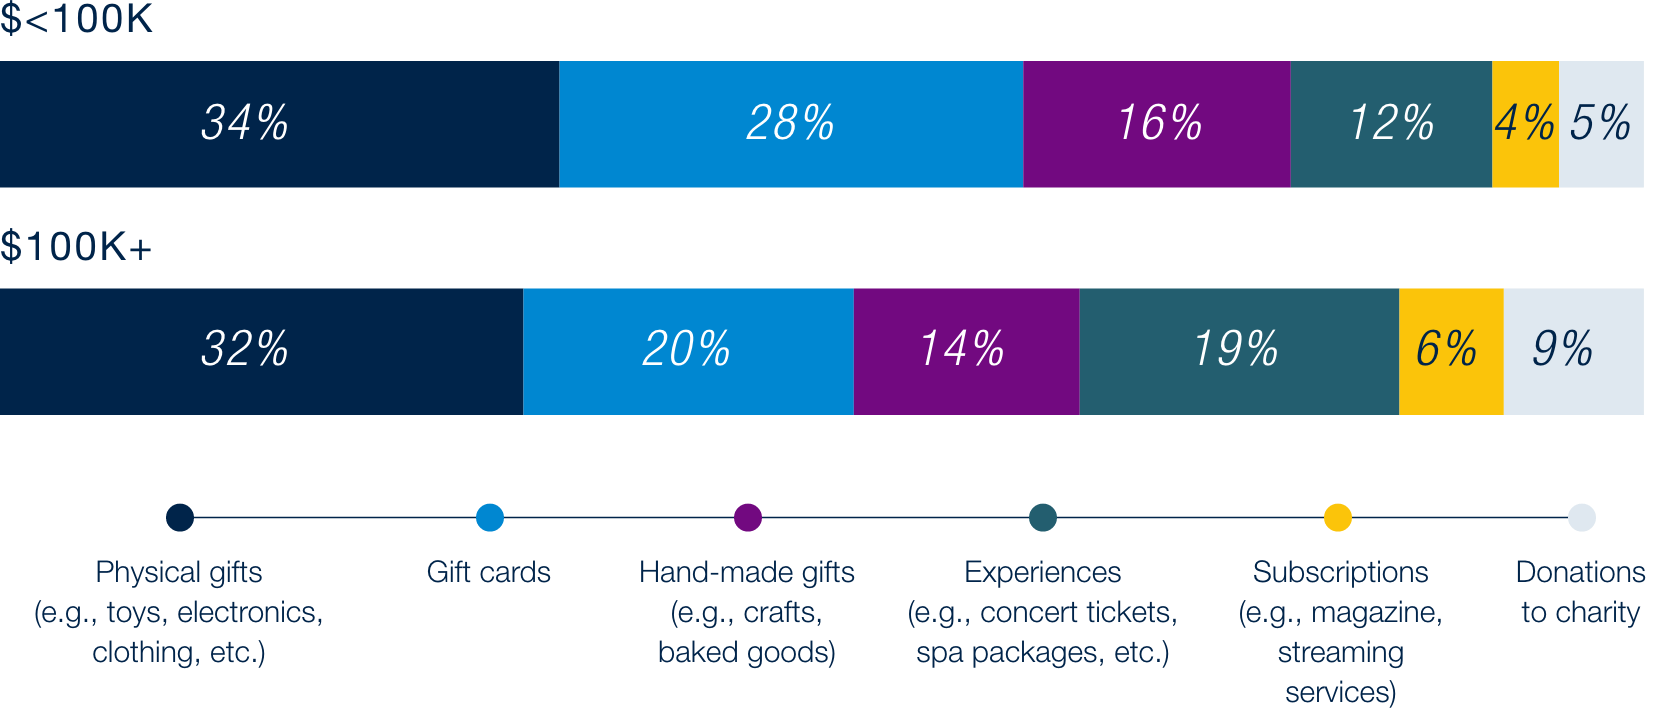
Despite tighter budgets and declining personal spending, holiday gifting remains a priority, with over half of consumers planning to give traditional gifts like physical items or gift cards. Similar to last season, gift preferences are also similar across income levels, but lower-income households favor gift cards—a practical choice that supports basic needs spending while preserving the spirit of giving. On the other hand, higher-income households favored ‘non-traditional’ gifts such as experiences and donations to charity. These patterns highlight how households adapt their gifting strategies to balance meaning and utility during the holiday season.
Gift Preferences by Household Income
Consumers are entering the season with caution. Higher-income households remain confident, while lower-income groups are pulling back. Tariffs and rising prices are top of mind, and shoppers continue to make careful trade-offs. Health concerns are driving cutbacks in alcohol and snacks. Overall, holiday spending is expected to stay flat, with only modest growth in self-gifting.

Methodology
Respondents matching U.S. adult population according to gender, age, ethnicity, region & income