Consumer Sentiment Survey Fall 2024
Back to All InsightsU.S. Spending Hesitant As Economic Uncertainty Persists
Alvarez & Marsal Survey of 2,100+ U.S. Consumers Highlights Weak Consumer Confidence this fall
In August 2024, A&M Consumer and Retail Group surveyed over 2,100 U.S. consumers to gauge their optimism levels, shopping intentions, desired purchases, and preferred shopping channels. Our findings indicate a cautious consumer mindset as we head into the fall season, a trend that persists from spring. Many consumers express mixed feelings about the current U.S. economic conditions, leading to increased apprehension about spending. As a result, individuals are prioritizing saving and cutting back on non-essential purchases. This trend of cautious spending is expected to persist throughout the holiday season, with shoppers adopting a more measured approach to their buying decisions.
Consumers have maintained conservative spending habits since last holiday’s sharp pullback
High inflation and interest rates keep consumers cautious, with politics having less of an overall impact
Shoppers are abandoning fresh food and restaurants for packaged meals while reducing health purchases
Store loyalty programs matter more to customers than brand names as deals drive decisions
Consumers plan to buy fewer total holiday gifts in 2024 rather than downgrade gift quality
As budgets tighten, consumers are spending more time researching and spending less money overall. Retailers need to offer value to consumers to earn their business.
Consumer behavior shows consistency in 2024. The flat consumer sentiment since Spring 2024, with a marked decline from Fall 2023, suggests consumers made deliberate spending adjustments after last holiday season and are maintaining these more conservative habits rather than returning to previous spending patterns.
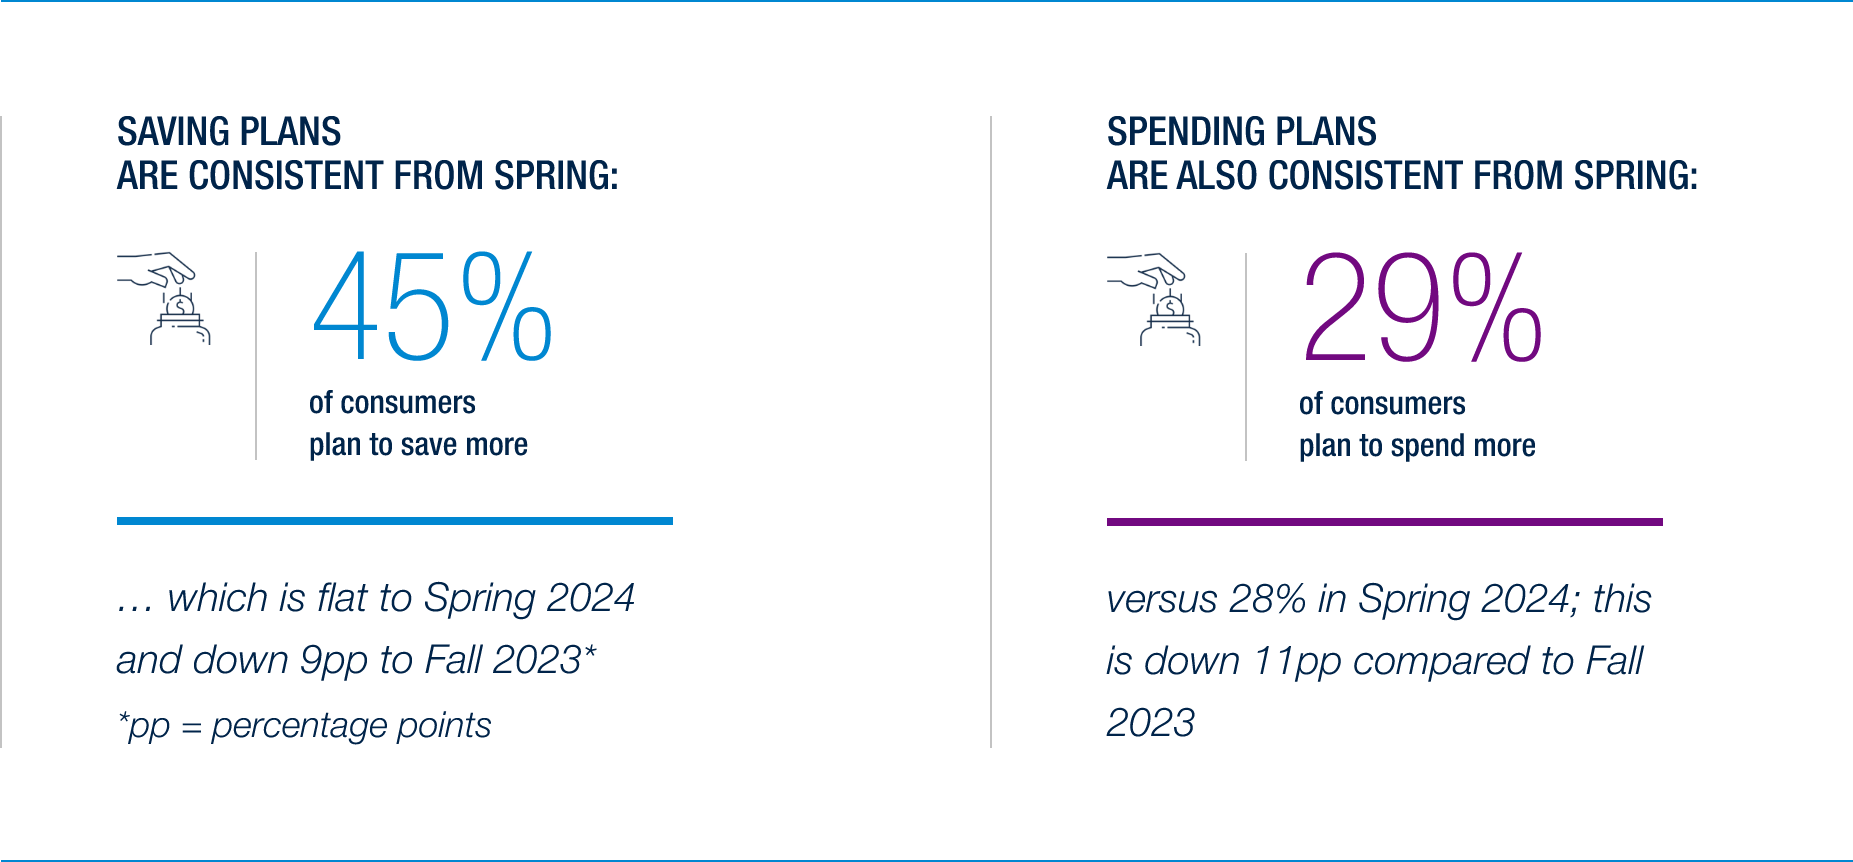
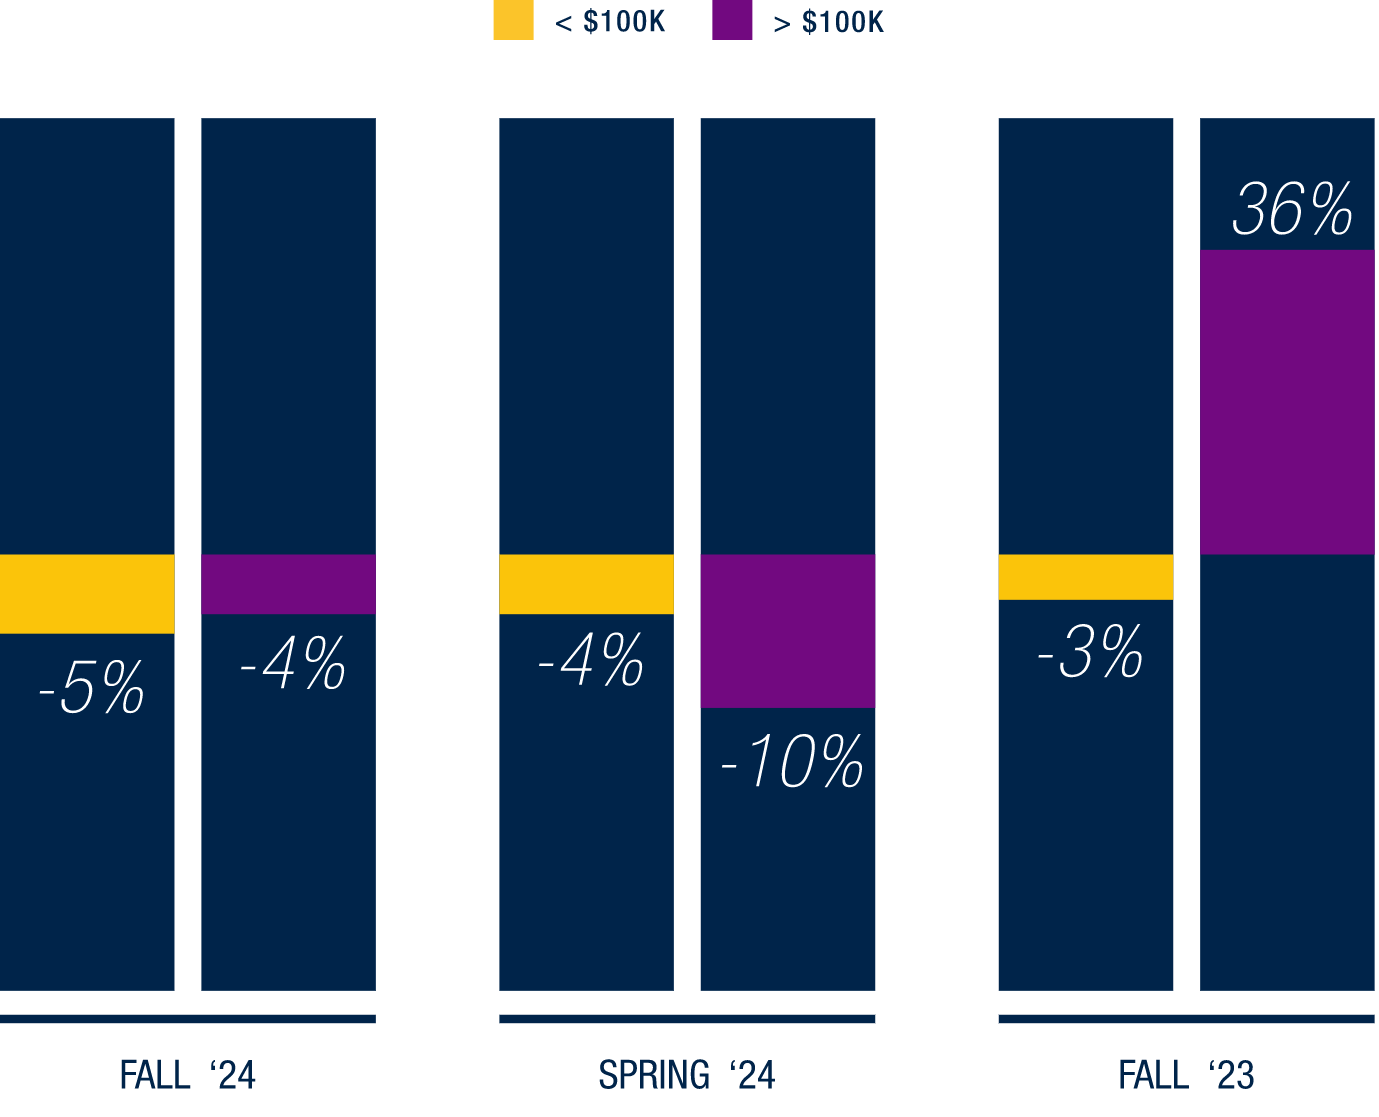
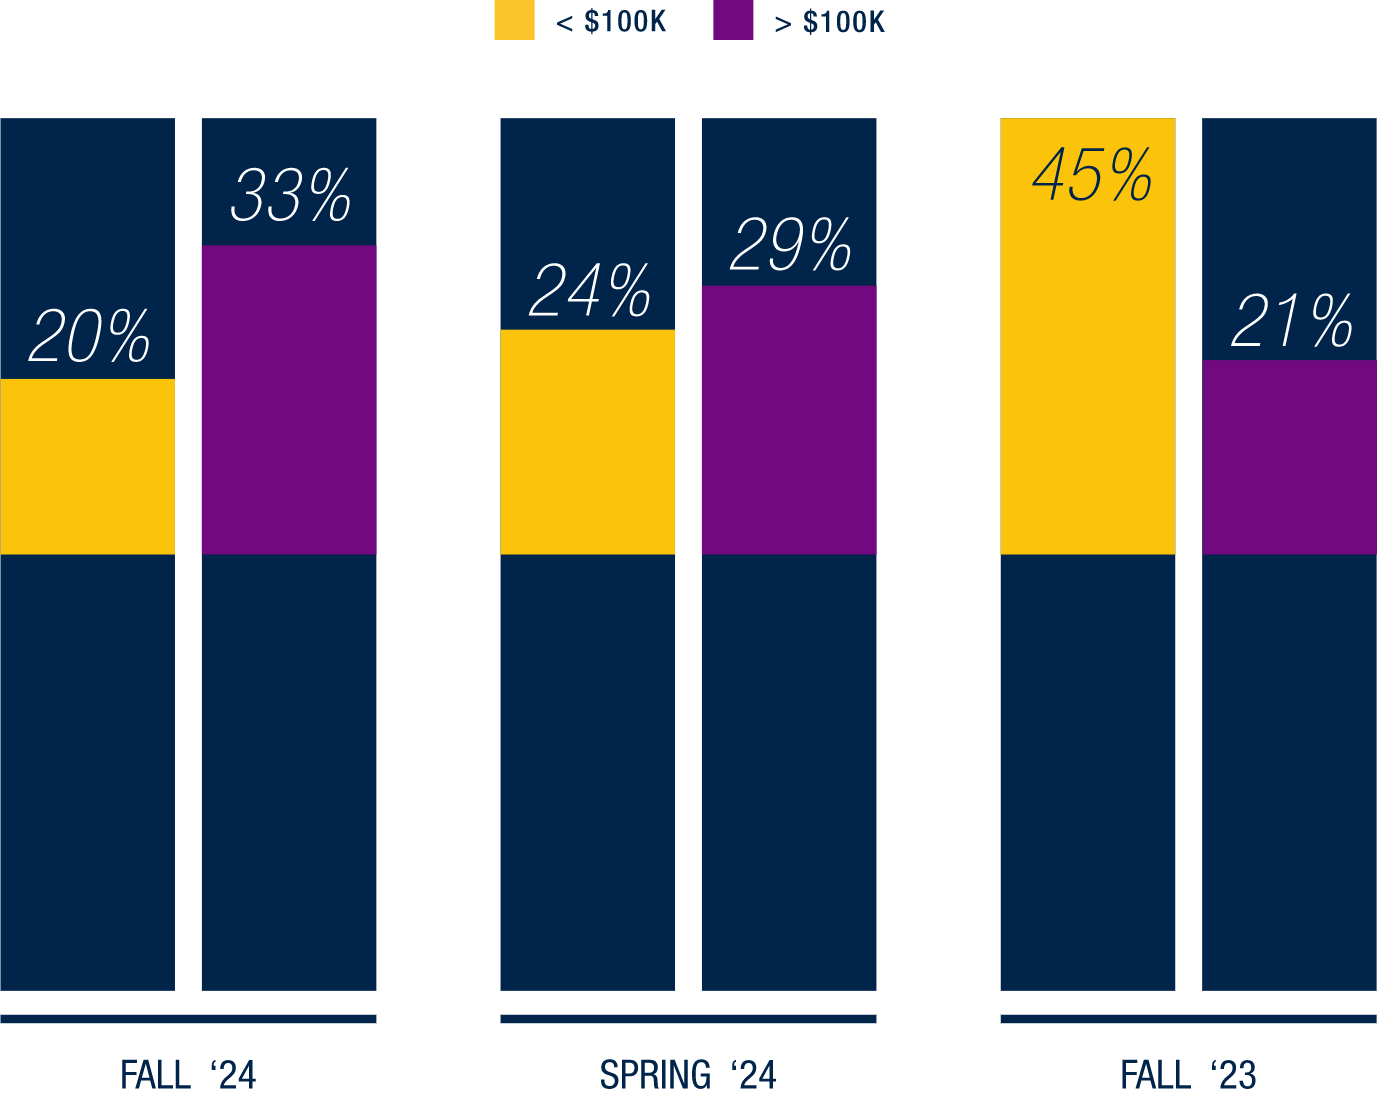
Spending plans for less affluent households, those earning less than $100,000 annually, have decreased compared to the spring of 2024. In contrast, more affluent households are showing relatively consistent planned expenditures compared to the previous spring. These higher-income consumers are prioritizing saving over spending at a greater rate than they were in the spring of 2024.
Macroeconomic Impact on Spending
Personal financial uncertainty is driving cautious economic behavior, as consumers struggle to understand their future financial security. The top 3 macro-economic factors weighing on consumers are inflation, interest rates and the job market. Interestingly, the upcoming (at the time) election was weighing the least on the minds of respondents. This indicates that tangible outcomes are overpowering speculation when it comes to economic concerns. With the election now over, we will continue to monitor if these pre-election trends remain at the same level of concern.
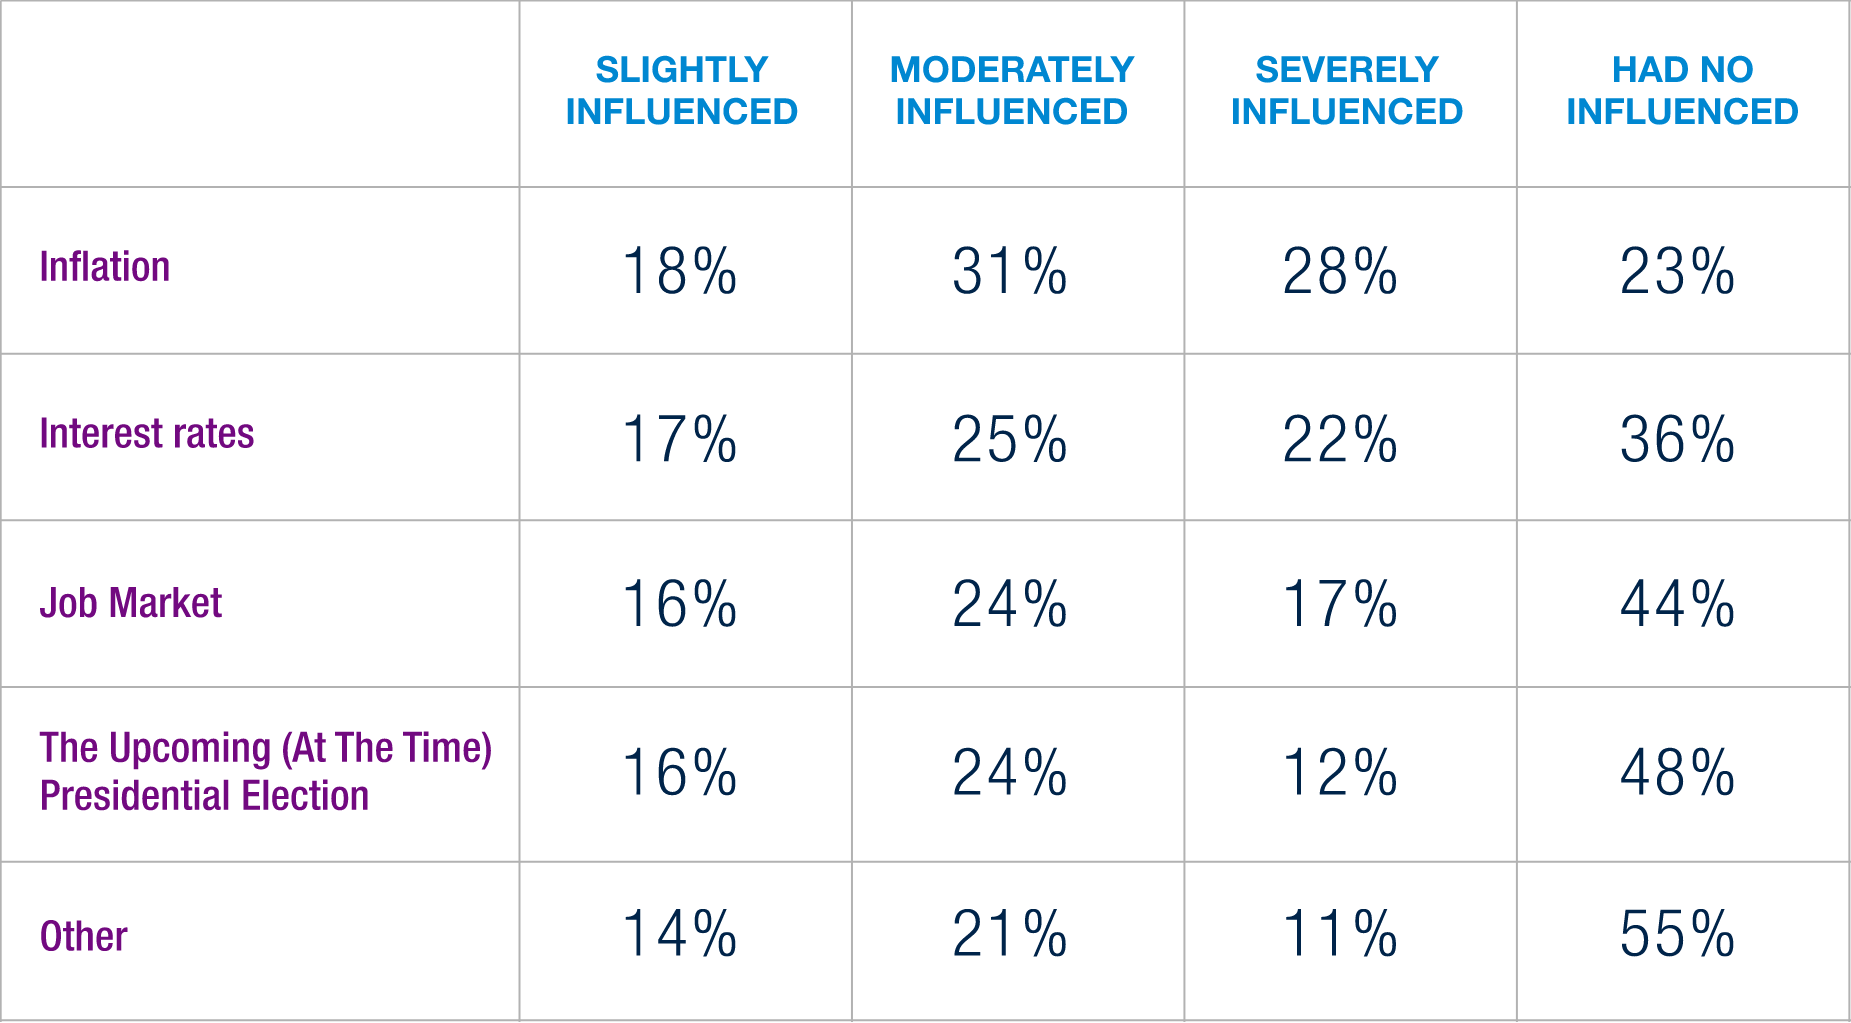
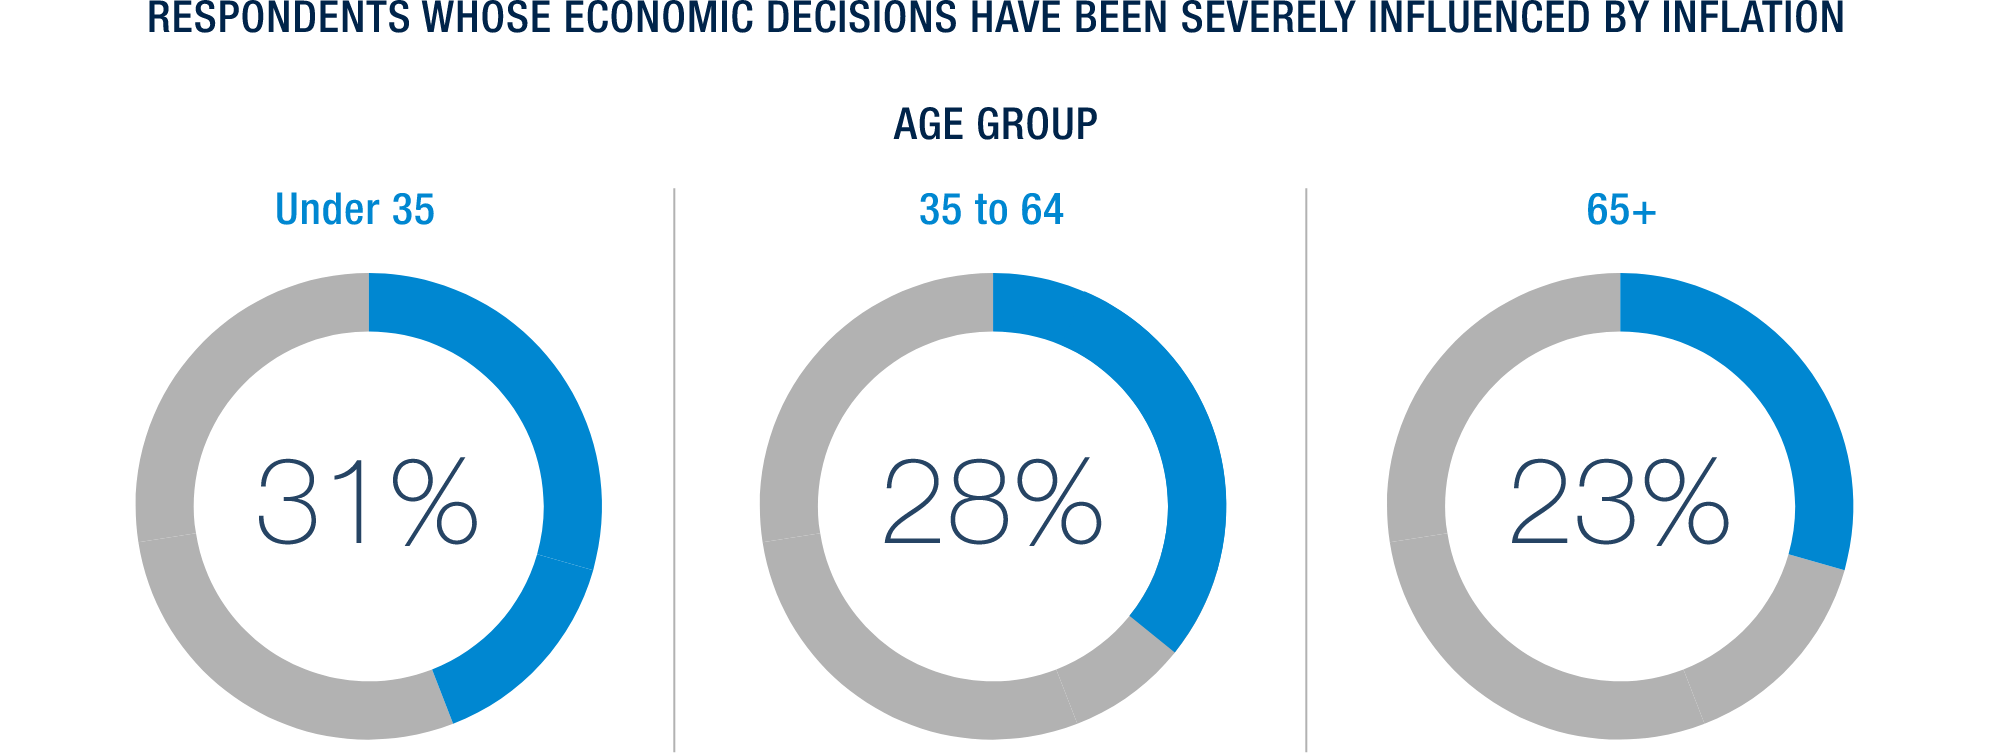
Inflation has been on the forefront of consumers minds throughout our survey for multiple cycles now, and this one is no different. Inflation is the number one factor severely weighing on the minds of respondents as they filled out our survey. Interestingly, when examining the data by age, the trend remains relatively flat, with a slight uptick in concern as age increases.
Category Spending Plans
As we dive into consumer spending trends, it’s clear that basic needs still dominate the landscape. However, we are seeing a greater degree of financial scrutiny when compared to previous cycles. For the first time we are seeing a decline in both fresh and prepared food, and notably a significant uptick in dry packaged grocery. This indicates that consumers are opting away from expensive meats and produce to purchase cheaper canned and packaged alternatives.
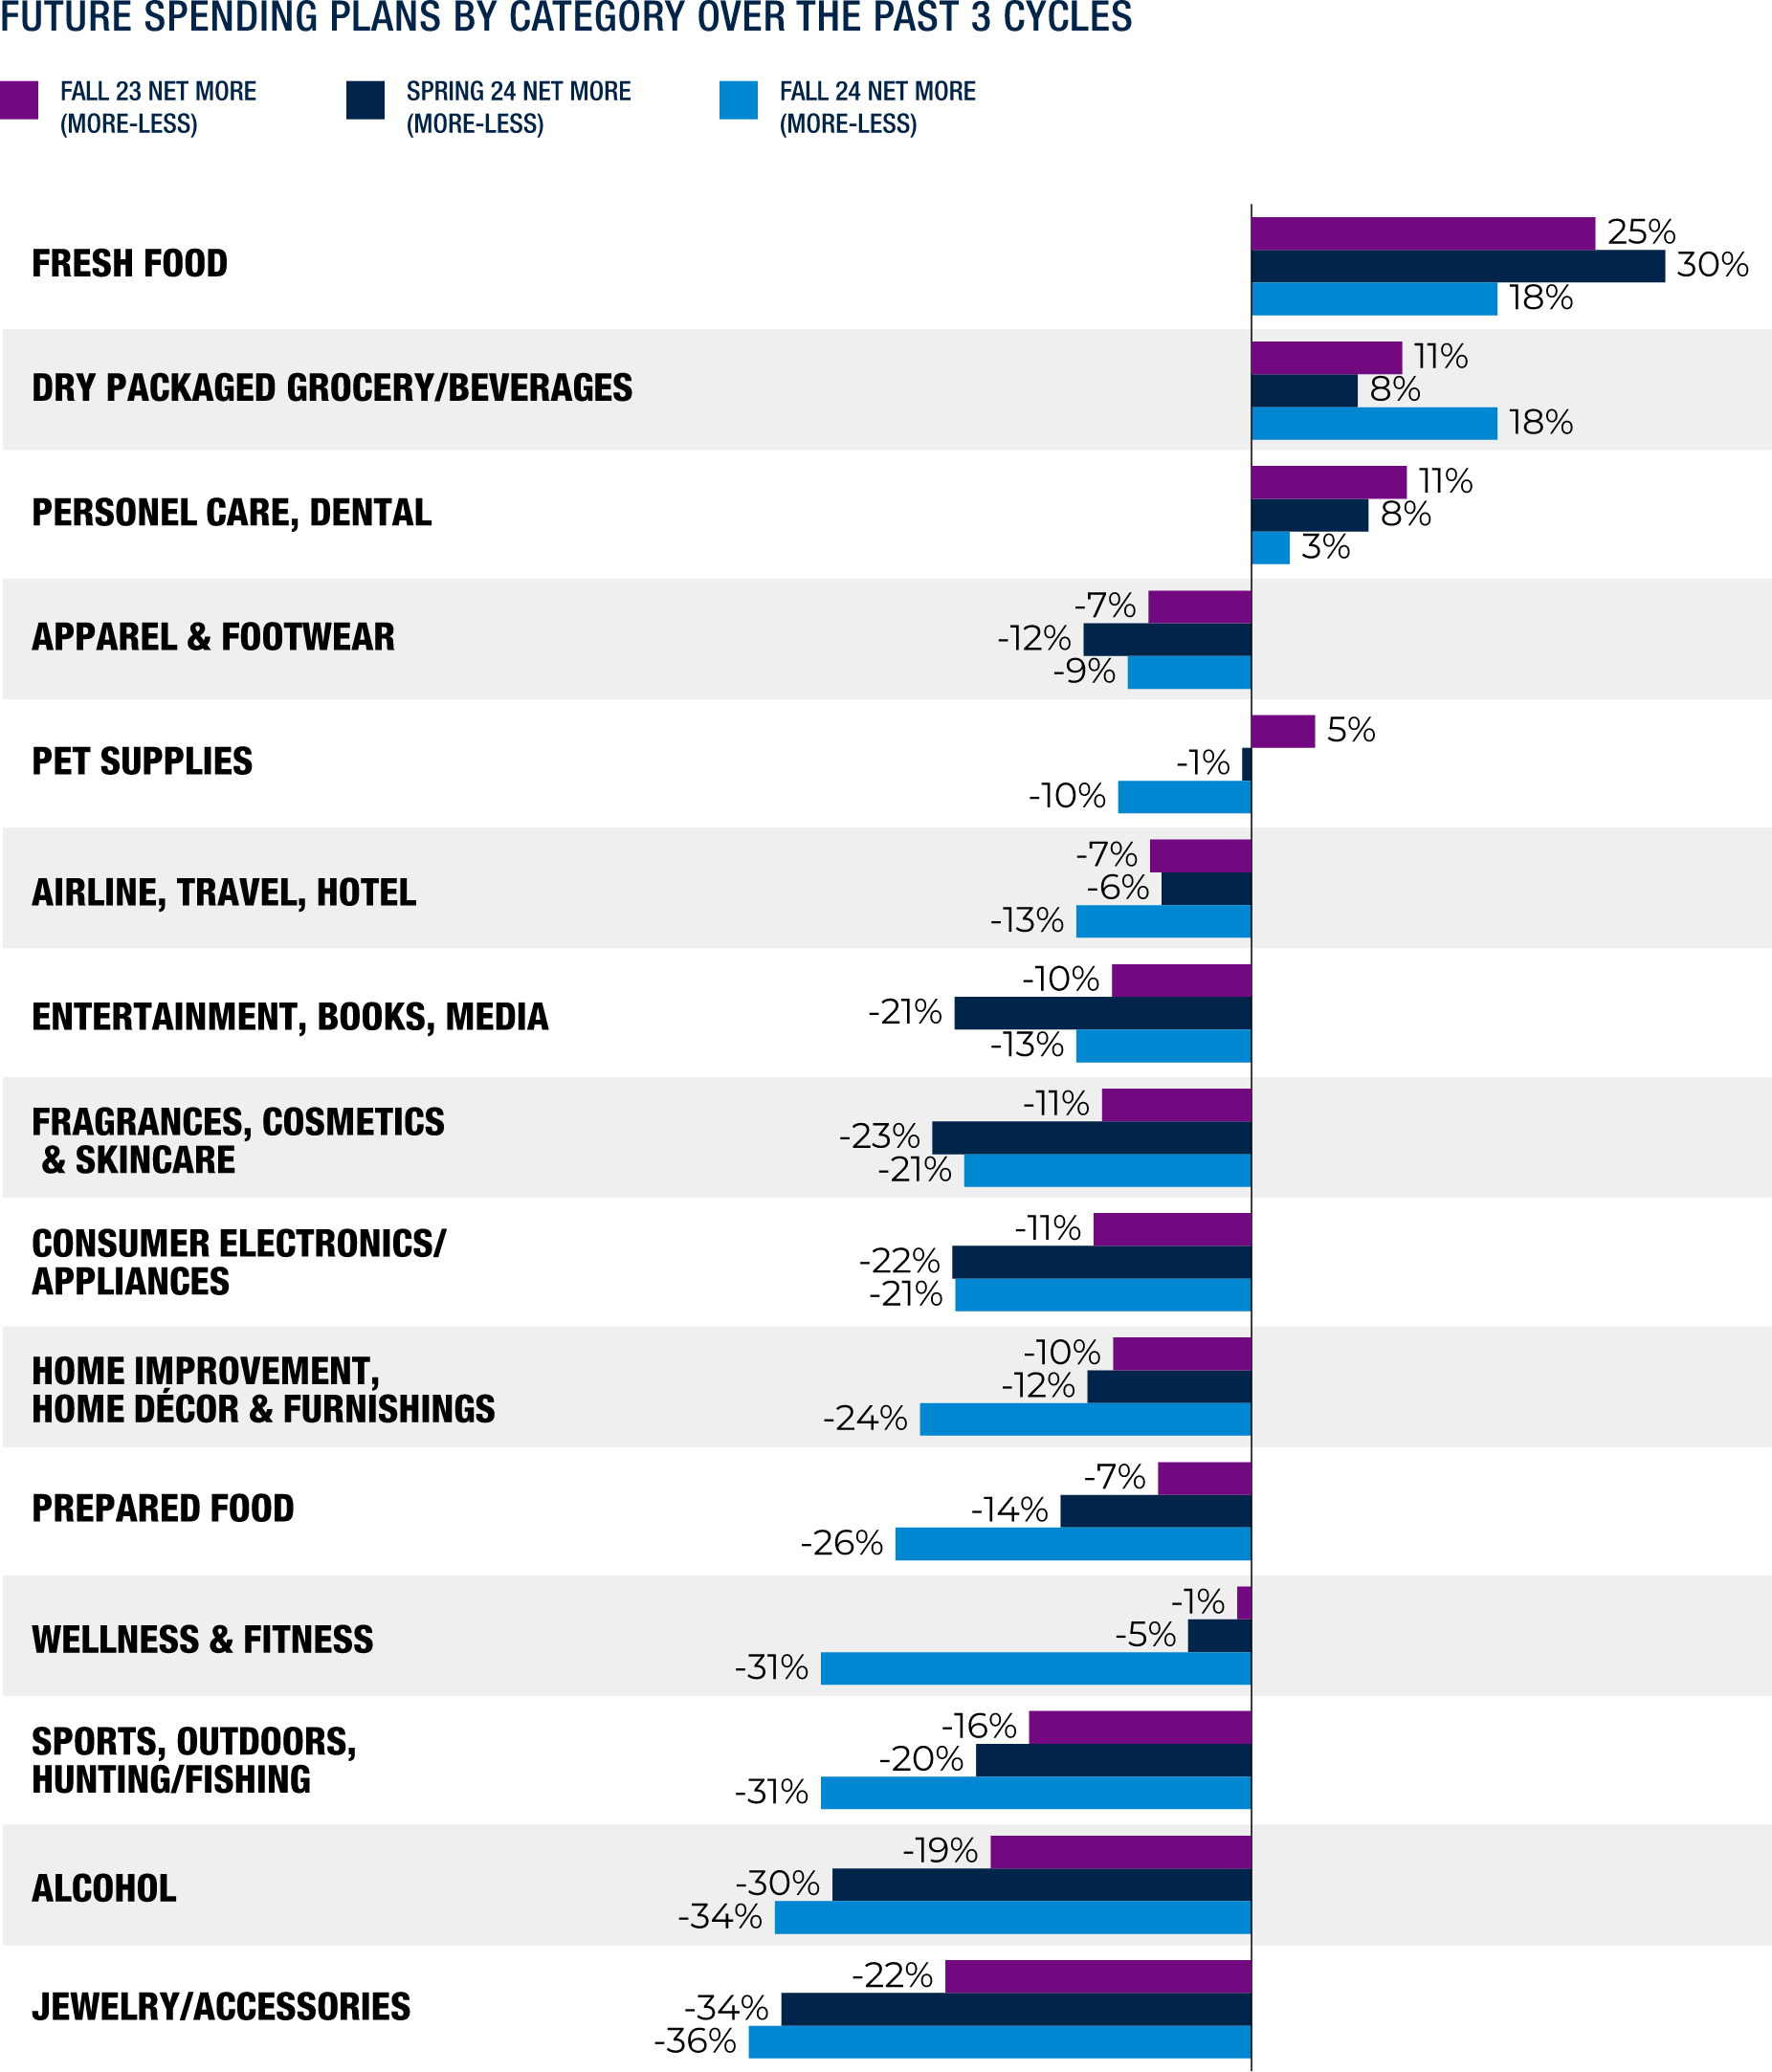
What’s particularly striking is the sharp downturn in wellness and fitness categories, which have fallen from previous highs. This could indicate a shift in perception around viewing a healthy lifestyle as more of a luxury than a basic need. These trends indicate that consumers have settled into the uncertain economic reality.
When asked how they would allocate a moderate increase in income, respondents prioritized groceries and savings, followed by travel & entertainment and restaurants. When looking into how these trend broke down by age, we saw high/medium-income households contributed to pushing travel / entertainment into the third position. Additionally, lower income households were driving savings and groceries to the top of the chart. This continues to reflect the prioritization of more essential categories in lower income households, and a skew towards discretionary spending for higher earners.

Tradeoffs by Category
The past 4 consumer sentiment surveys all highlighted financial pressures felt by consumers. To better understand the trade-offs being made, we analyzed two spending categories: groceries and beauty products. A majority of consumers in both categories confirmed they have adjusted their spending. In essential categories like groceries, consumers plan to economize by first switching to lower-cost brands and products before switching to a lower-priced retailer. For non-essential items, consumers will first reduce consumption and secondly switch to a lower-priced brand at their preferred store to save money before they would switch to a lower-priced retailer. This indicates that retailer loyalty is more important than product/brand loyalty, allowing retailers to dial in the correct assortment at every price.
HOW CONSUMERS PLAN TO CUT BACK BY CATEGORY

This trend of “cost optimization” for essentials and “consumption reduction” for non-essentials spans nearly all income levels, with consumers across all household income brackets prioritizing cheaper grocery alternatives and reducing beauty product consumption. A notable exception is households earning over $200,000, where over 40% reported no changes in spending habits for either category.

Channel Habits
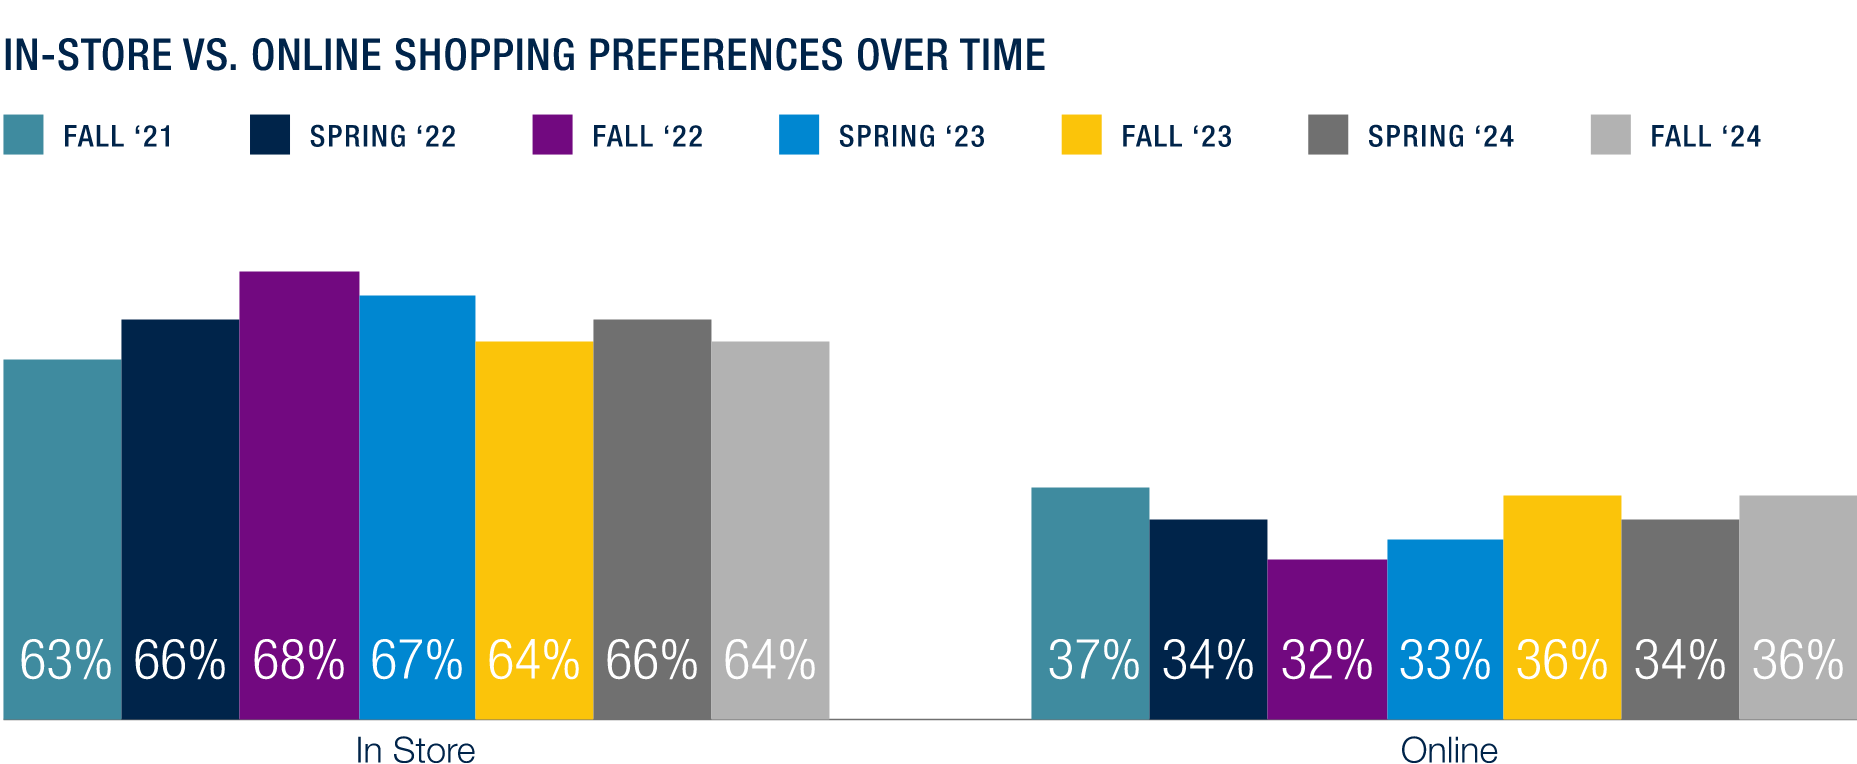
Physical retail continues to demonstrate resilience, with over 60% of respondents in our bi-annual survey consistently preferring in-store shopping to online alternatives—a trend that has held steady for seven consecutive cycles. Unlike other consumer trends where older shoppers help prop up a waning preference, here we see no signs of preference for in-store shopping going away and retailers can be comfortable continuing to invest in the right set of merchandise and experiences.
In-store shopping popularity shows a generational pattern. It is more prevalent among younger consumers (under 34, encompassing Millennials and Gen Z) and older shoppers (55+), compared to middle-aged consumers (35-54). Shoppers under 35 are drawn to in-store shopping for immediate product availability, while those 55 and older value the chance to touch and feel product items.
IN-STORE VS. ONLINE SHOPPING PREFERENCES BY AGE GROUP

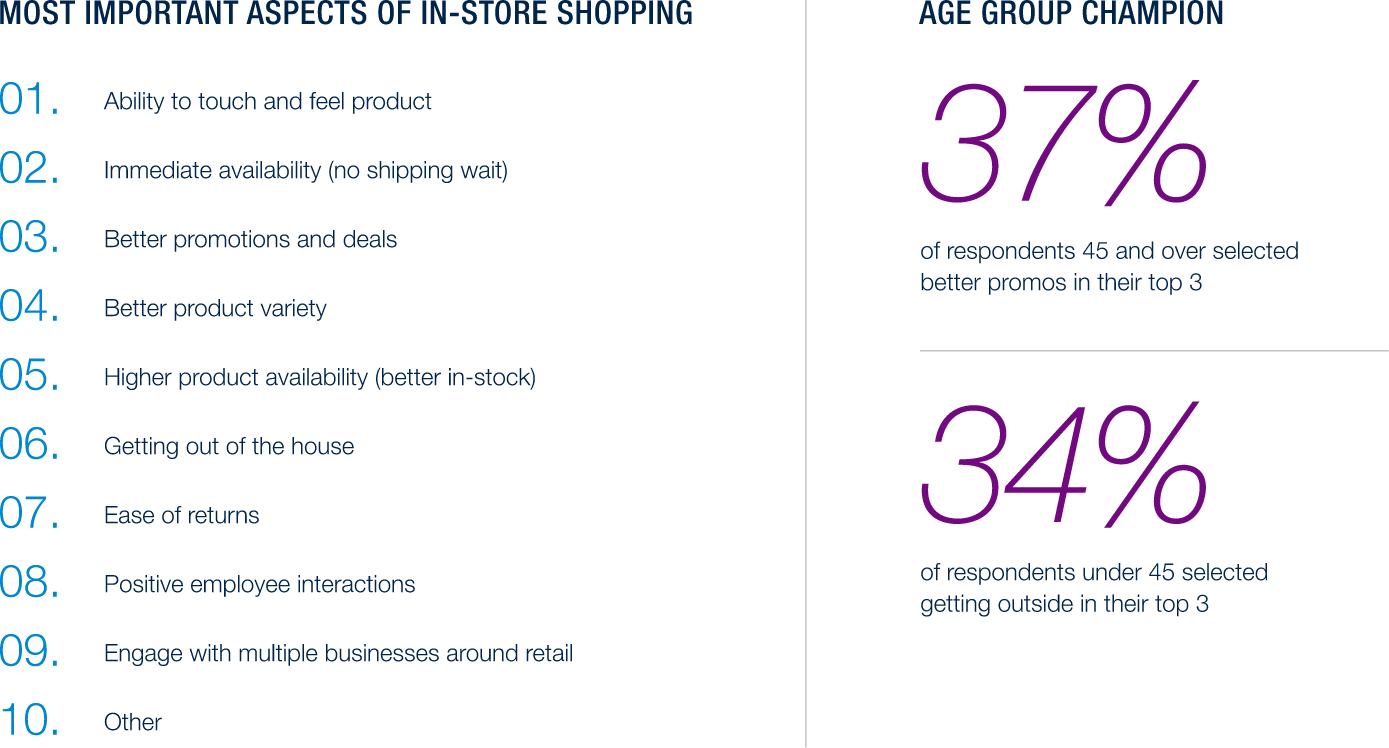
In-store shopping preferences are primarily driven by immediate gratification and tangible product experiences. For every age group, the highest percentage of number 1 ranked experiences was either the ability to touch and feel the product or immediate availability. Furthermore, 50% of respondents ranked the ability to physically interact with products as a top 3 reason for choosing in-store shopping. However outside of those categories, a different trend emerged with age, with older demographics favoring the in-store promotions, and younger demographics citing getting out of the house as a meaningful part of the in-store shopping experience.
We wanted to gauge at which frequency level of shopping do customers prefer, the online or in-store experience. Grocery was the main stand out, that skewed heavily towards in-store for regulars and online for the less frequent. However, all other categories remained relatively flat, with a slight edge towards in-store for the less frequent. This could be because grocery is still the most expensive online shopping experience. While all other categories normally have shipping fees waived, ordering your groceries online comes with a hefty premium in the form of tips and services fees while also removing the ability to make changes in the absence of a product. This underscores that even in the face of added convenience and a potential time-saver, consumers are not willing to pay the extra buck.
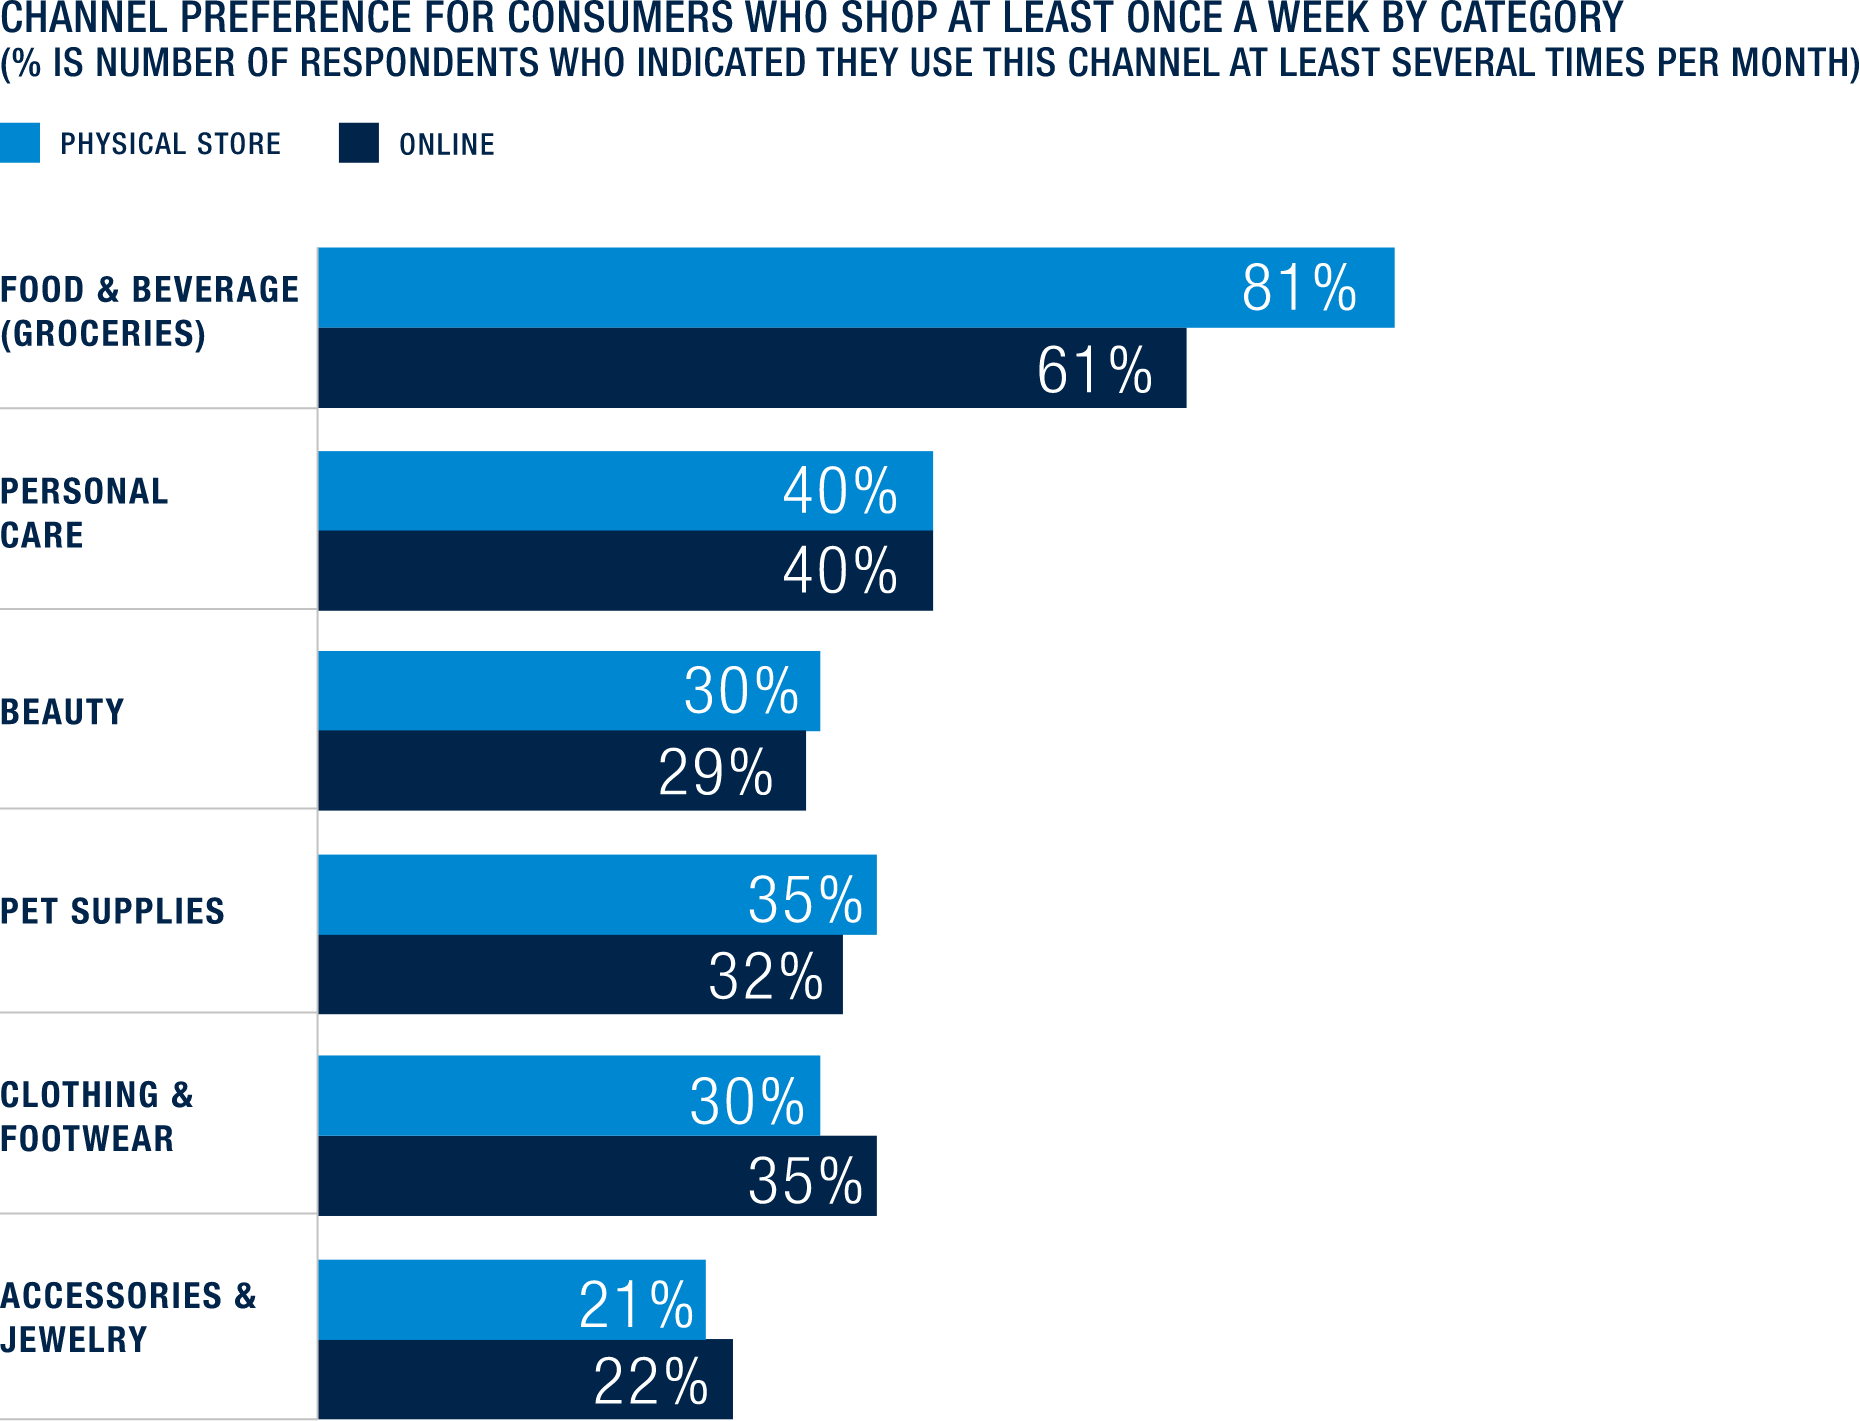
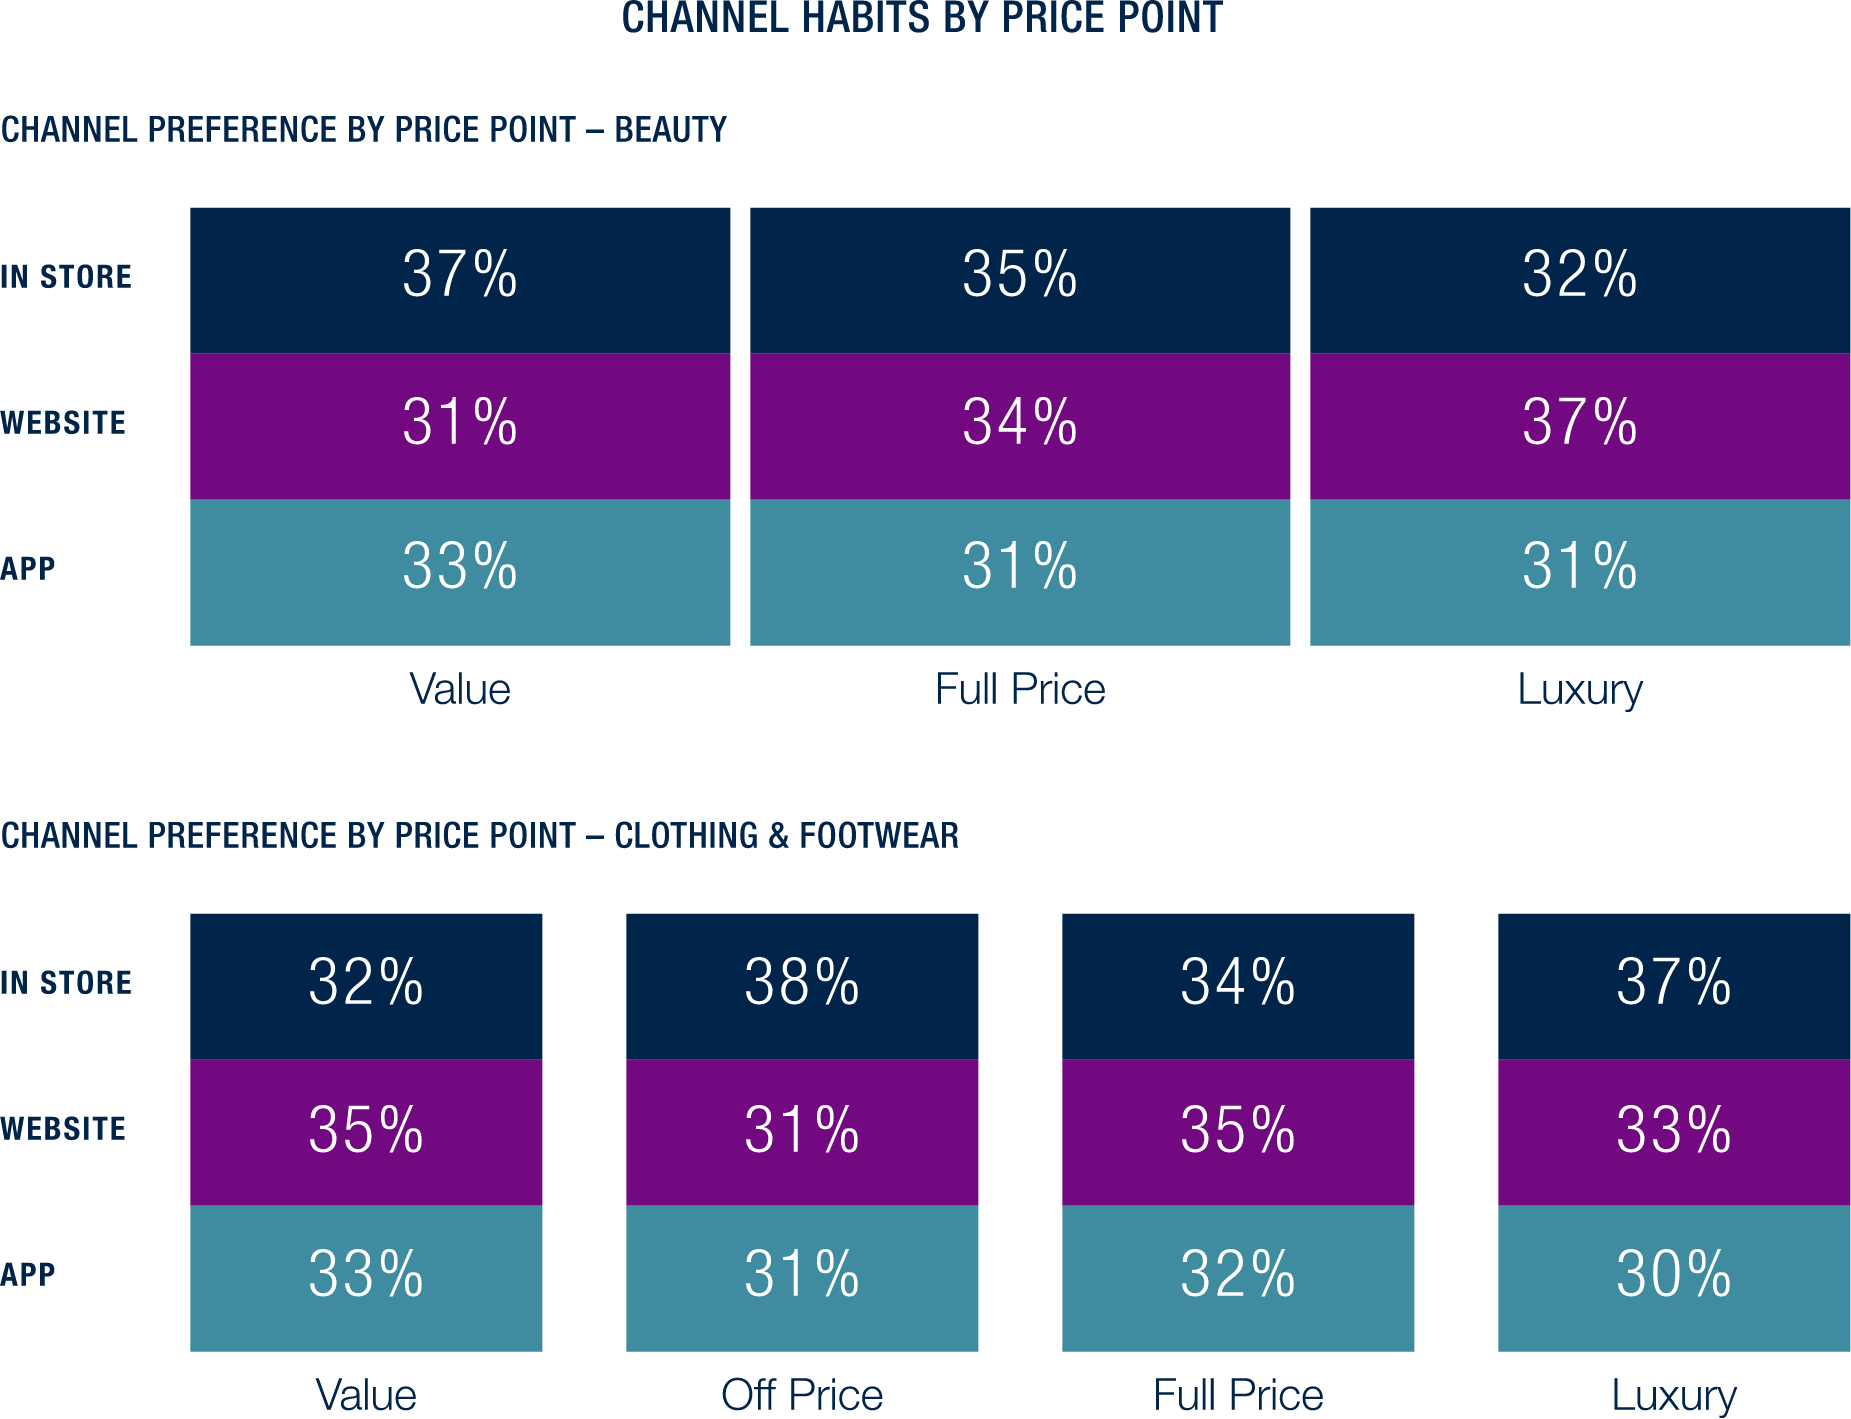
We also looked at consumer channel preferences by price point and the results reveal an interesting pattern: shopping behavior varies based on both price point and product category. The survey data highlights a slight contrast – while luxury beauty consumers favor digital channels, luxury fashion and footwear customers lean more towards the physical retail experience (+5pp). This understanding should reshape how retailers approach their pricing architecture, requiring careful calibration across both product tiers and categories to optimize their market position and meet customers where they naturally gravitate. Given these subtle preferences, a strategic approach to building a cohesive omni-channel shopping landscape can help retailers capture maximum consumer spending.
Loyalty
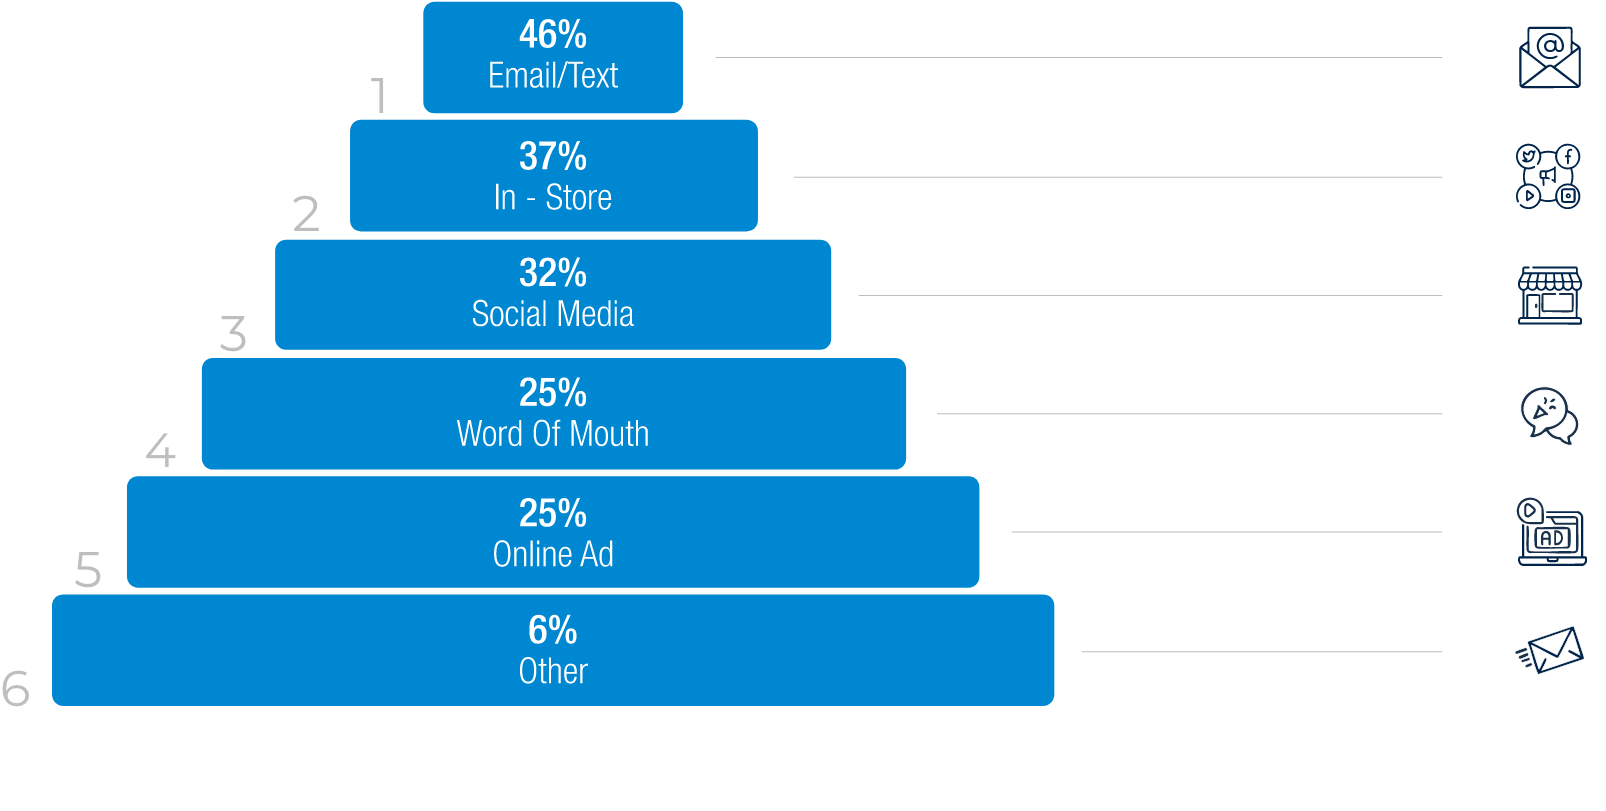
Loyalty programs remain popular with customers, but driving sign-ups can still be challenging. The most effective methods across all categories are email or text invitations, in-store promotions, and social media campaigns. Meanwhile, more expensive strategies like direct mail and online ads are proving less effective, ranking lower in acquiring loyalty program members.
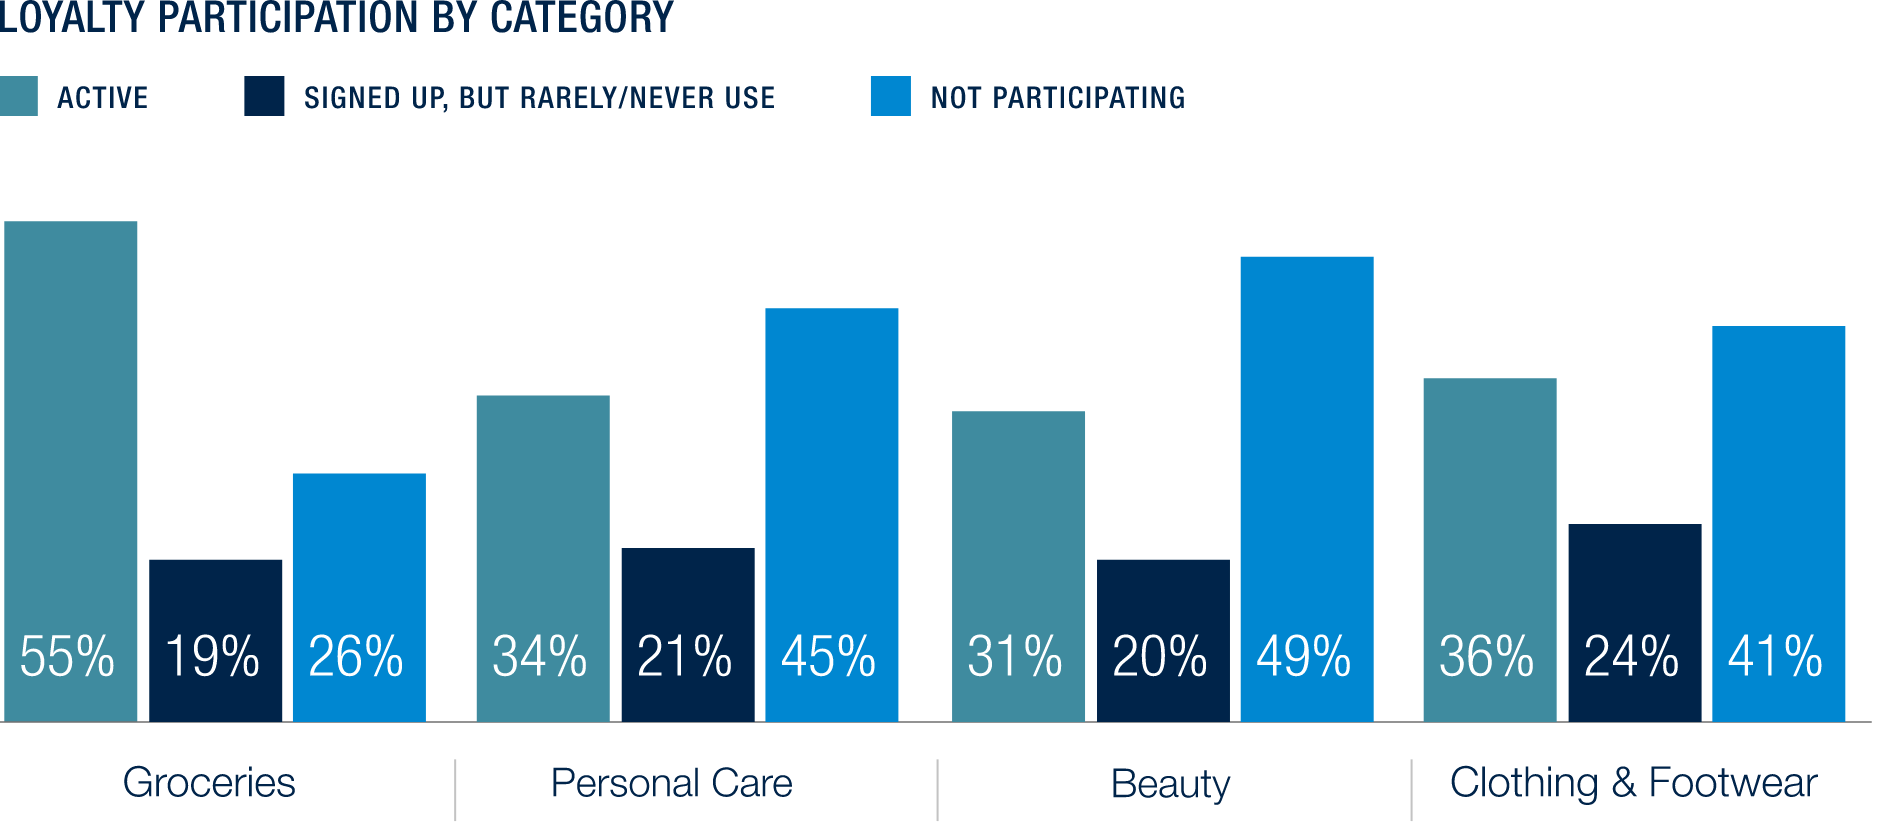
Consumer participation in loyalty programs remained strong across all demographics, indicating that all shoppers love a good rewards program. In 3 out of 4 categories surveyed, 31-36% of consumers signed up for loyalty programs remain active. The fourth, groceries, is the clear winner here, with 55% of all consumers remaining active in loyalty programs.
Over the past three survey cycles, our analysis has consistently tracked loyalty program engagement. While previous cycles confirmed savings as a primary motivator, this cycle the survey deliberately excluded direct savings as a motivator. However, with flexible and attainable rewards being the top categories, it is clear that monetary gains outweigh an experiential benefit. Additionally, our findings reveal a clear generational divide in reward preferences. Nearly two-thirds of participants under 45 (64%) prioritize experiential elements, with exclusive access being the top feature. In contrast, those 45+ show preference for tangible benefits, with 60% prioritizing reward value and attainability. These insights suggest the need for age-segmented approaches to loyalty program design.
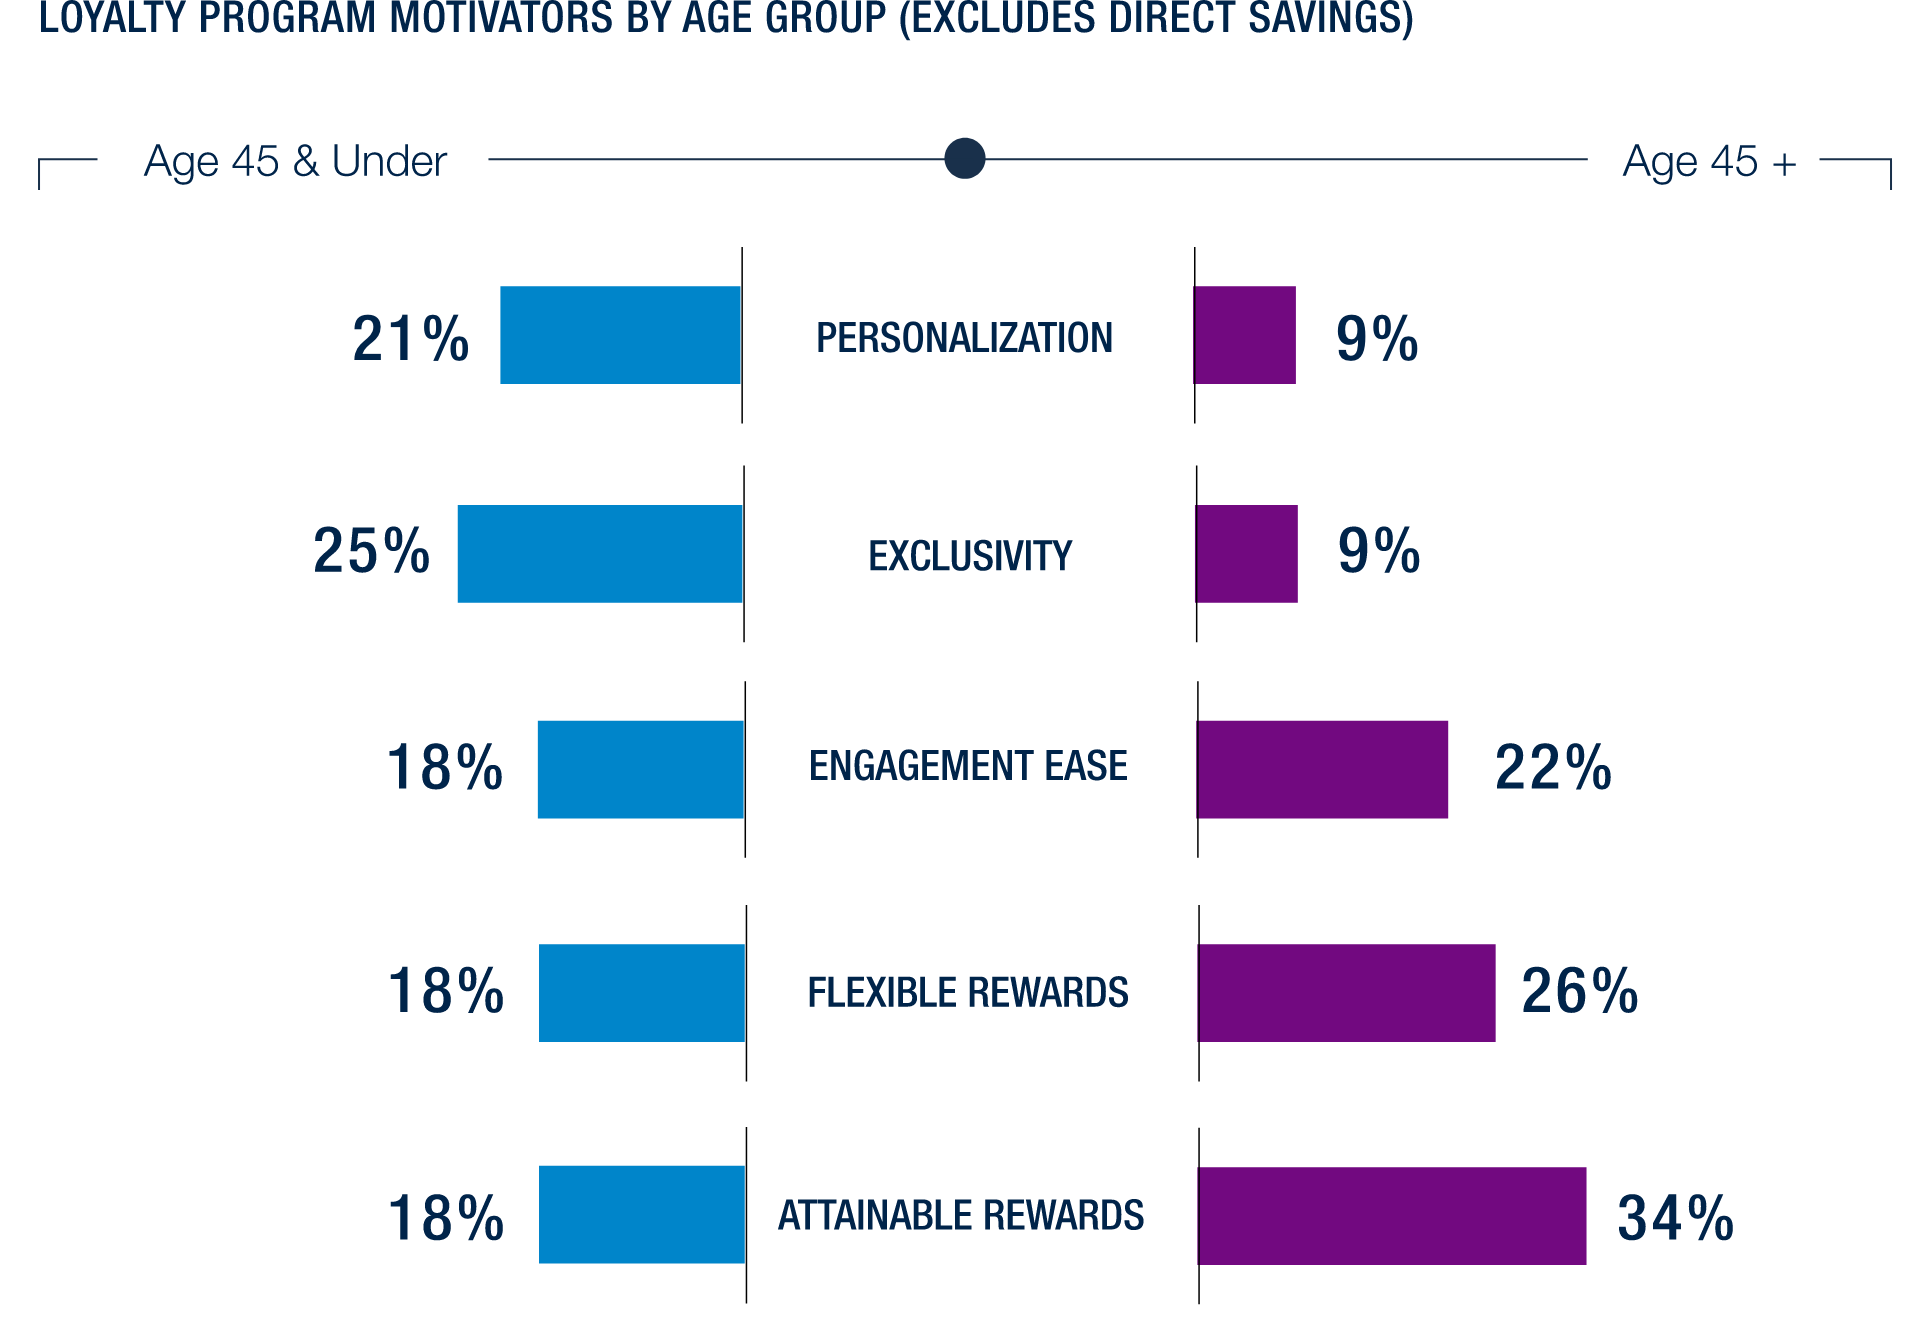
Improved customer experience is always on the mind of retailers. User experience becomes more important as we look to younger age groups. The older one gets, the more they prioritize elements of savings. Younger demographics clearly favor a seamless experience above all else. It is much easier to markdown a product than it is to develop a smooth loyalty experience, and this requires retailers to be hyper aware of who their core customers are and deliver them the benefits they value most.

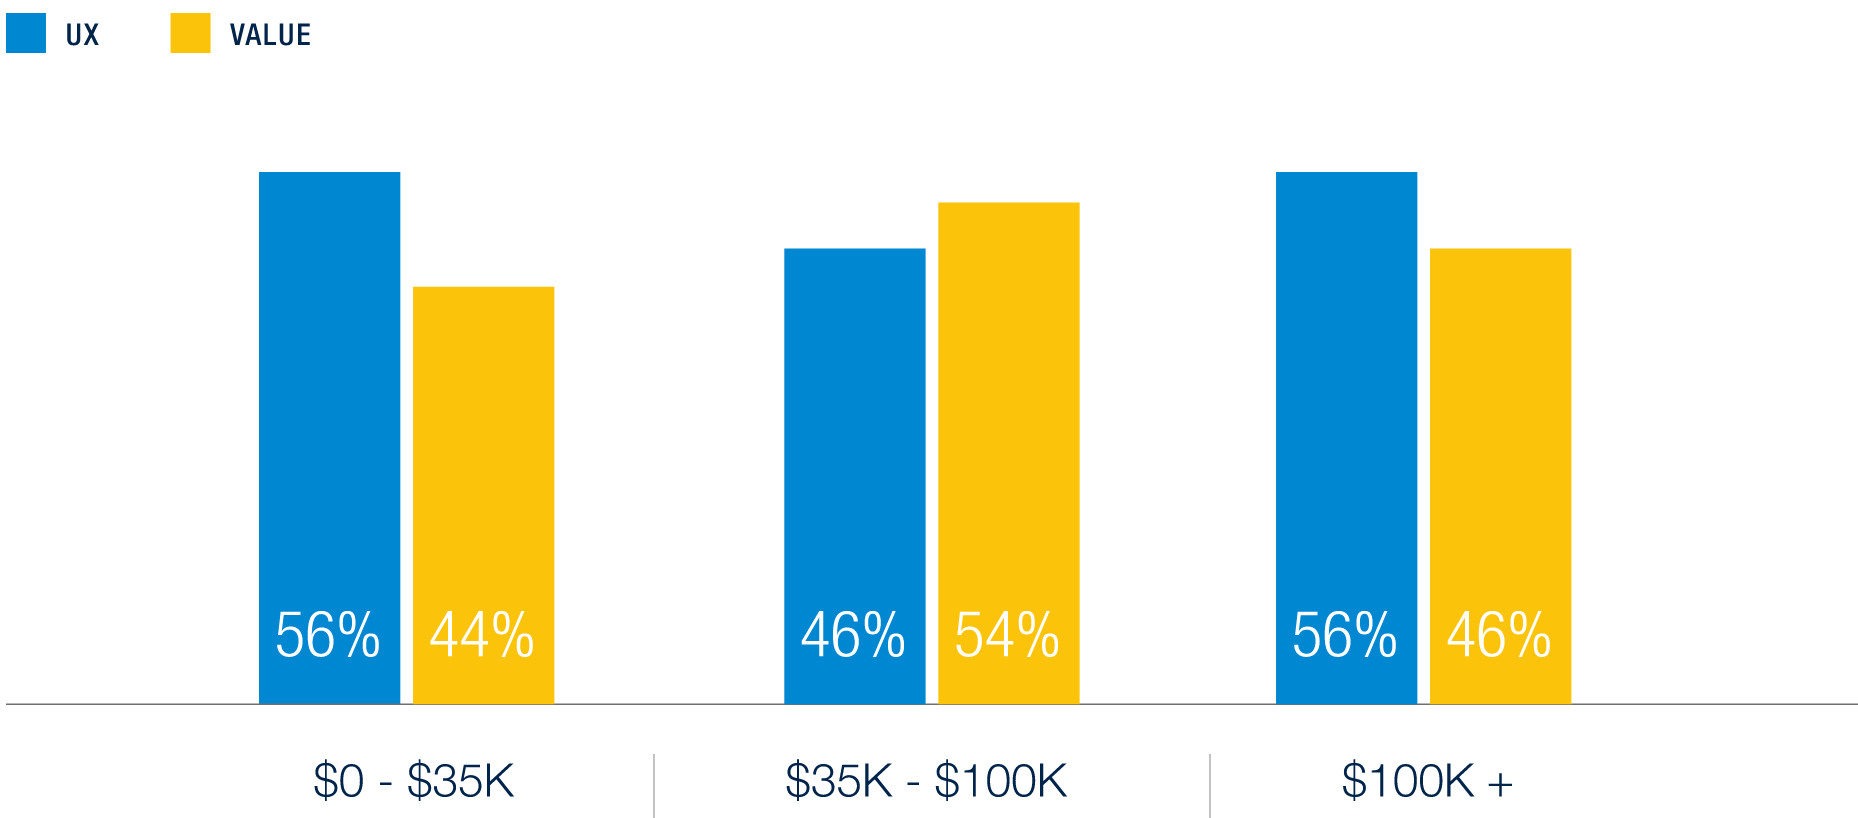
USER EXPERIENCE VS. REWARDS VALUE – LOYALTY MOTIVATION BY HHI
Just as generational differences shape consumer behavior, household income levels play a significant role in how consumers approach and value rewards programs. Those who earn a medium amount ($35K-$100K HHI) tend to be the ones most considering value of rewards when considering joining rewards programs. Both ends of the economic spectrum, both the highest earners & lowest earners, seem to place slightly greater value on user experience aspects of rewards (personalization, exclusivity, engagement ease) when thinking about which rewards programs are a good fit for them.
Holiday Shopping
Even though we saw higher income households are planning to be more cautious overall in Fall 2024, this trend did not apply to holiday shopping this year versus last year.
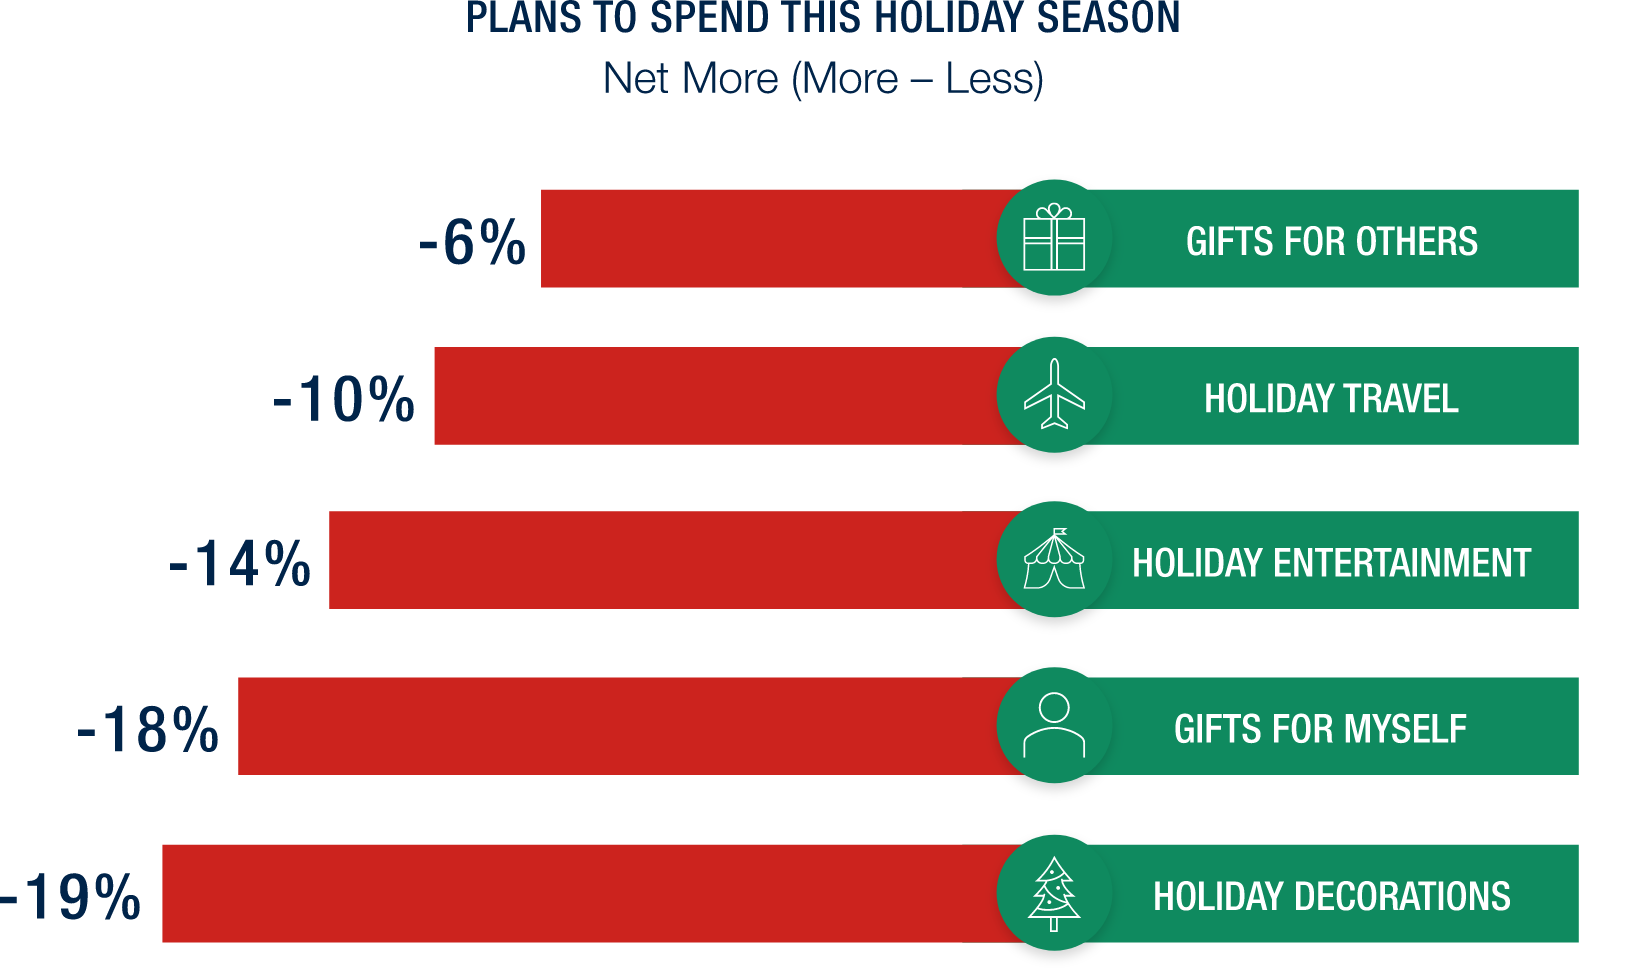
Consumers are planning to spend less on gifts, travel, entertainment and decorations this holiday season (planning to spend -9% net more on total holiday this year).

As we approach the holiday season, a clear trend of cautious spending continues to shape consumer behavior. Households plan to spend 9% net less this holiday season compared to last year—a noticeable decline that spans across nearly every category, from gifts and travel to entertainment and decorations. When it comes to gift-giving, the cutbacks are even more pronounced, with consumers planning to reduce both the number of gifts they buy (-10% net more) and the number of people they’re purchasing for (-10% net more).
With tighter budgets, retailers must be more agile and creative to capture attention and drive sales. Offering personalized promotions, value-driven bundles, or exclusive deals can help maintain customer interest without overburdening their wallets.
In their effort to stay financially savvy while still enjoying the holidays, high & low earners are using different methods to save. Lower income households plan to buy less expensive full-price gifts, whereas higher earners are more likely to find other ways to save, such as waiting for items to go on sale.

Holiday Channel Shopping
In-store has remained the dominant channel for year-round shopping; however, we consistently see a difference in behavior when consumers are thinking specifically about holiday: Consumers continue to gravitate more toward online shopping, with 38% planning to shop more online than in previous years, 25% (down from 29% last year) still intend to shop more in-store this holiday season compared to last year.
Different factors are attracting consumers to shop online vs. in-store. If consumers are looking to optimize for a fast checkout process and product availability, they’ll likely go online. If they’re after easy navigation, they’re more likely to choose in-store shopping, though promotions are key for both.

We’ve consistently seen that consumers prefer online shopping during the holidays, so this year, we aimed to explore reasons behind this trend more deeply. When trying to identify which parts of the in-store vs online shopping experience were swaying customers to chose online shopping, we were a bit surprised to see that it everything. All categories had a higher positive experience online and higher negative experience in-store, with online channel beating out in-store by an average of 5% in all overlapping categories. This indicates that the scale of the holiday shopping experience is outsized for the in-store model.


Despite tighter budgets and declining personal spending, holiday gifting remains a priority, with over half of consumers planning to give traditional gifts like physical items or gift cards. Gift preferences are also similar across income levels, but lower-income households favor gift cards—a practical choice that supports basic needs spending while preserving the spirit of giving. This pattern highlights how households adapt their gifting strategies to balance meaning and utility during the holiday season.

Consumers are revealing a more guarded outlook as we approach the holiday season. This growing caution, driven by mixed perceptions of economic conditions, manifests in consumers’ increased focus on savings and selective spending habits, suggesting a more deliberate approach to purchasing decisions in the months ahead.

