Consumer Sentiment Survey Fall 2026
Back to All Insights
U.S. Consumers Are Opening Their Wallets Again –Selectively, Health-First, And With AI Increasingly In The Loop

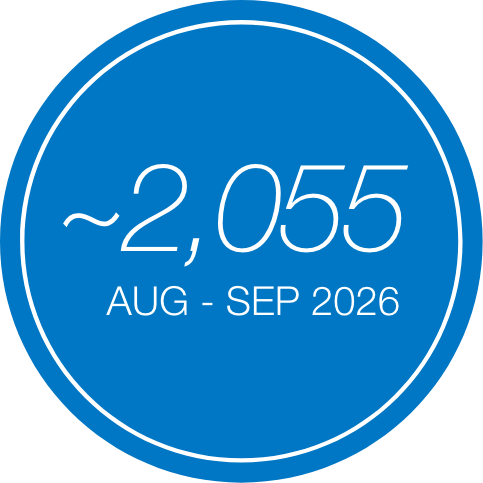
In late August and early September 2026, A&M Consumer and Retail Group surveyed over 2,000 U.S. consumers to understand their financial outlook, spending priorities, and shopping behaviors. Results show confidence is recovering unevenly, with higher-income households once again carrying spending momentum while lower-income groups make careful trade-offs. Heading into the holidays, consumers are prioritizing essentials, health, and value –and increasingly turning to AI and omnichannel journeys to find it.
- Recovery Broadens, Divide Persists
Higher-income confidence has resumed its two-year climb after a spring dip, with earning expectations above Fall ‘25 levels and spending expectations back to them. Lower-income households’ earning expectations slipped versus spring, yet they are willing to forego more savings to fund spending expectations that have now increased for three consecutive waves and are back to Fall ‘23 levels. - Two Very Different Spenders
Higher-income households plan to spend more across nearly every category, while lower-income households are adding spend only in groceries and holding flat or cutting back in more discretionary categories as essentials spending increased over the last 6 months (e.g., Groceries, Rent, Utilities) - A Two-Speed Holiday
Holiday spending intent has turned negative overall, but the split mirrors the income divide. Higher-income households are applying their stronger earnings expectations to the season, planning to spend more (+18% net), led by holiday meals and treats. Lower-income households plan to cut back across every holiday category (-26% net). - Value Without Compromise
Lower-priced grocers and store brands have reached experience parity in the eyes of ~70% of shoppers. Consumers are trading down where products are interchangeable and trading up –more often than last spring –where quality is visible. - Wellness Rewrites the Basket
Because GLP-1 users are eating less, they are trading up to nutrient and function rich food and beverages, and the broader population is following: ingredient-led snacking, functional beverages, and protein are gaining share of stomach and share of wallet. - AI Moves from Research to Decision
Despite continuing to have concerns about AI, more than four in ten consumers now let AI influence their final purchase decision, up 8 points in six months, and usage is shifting toward deciding when to buy.
Higher-Income Consumers Are Turning Stronger Earnings Into Spending, While Lower-Income Consumers Are Giving Up Savings To Keep Up With Essentials
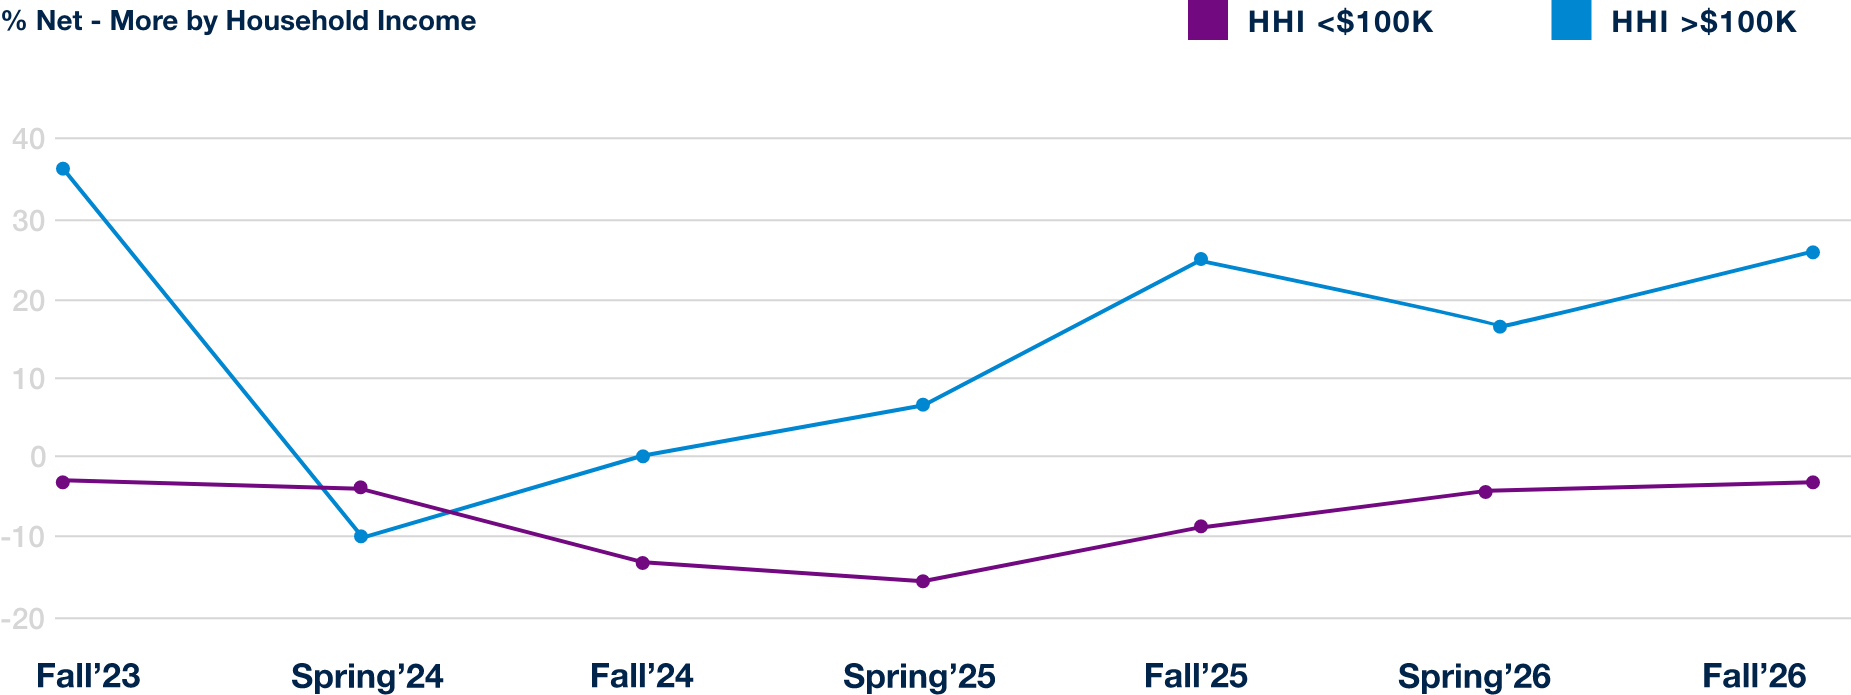
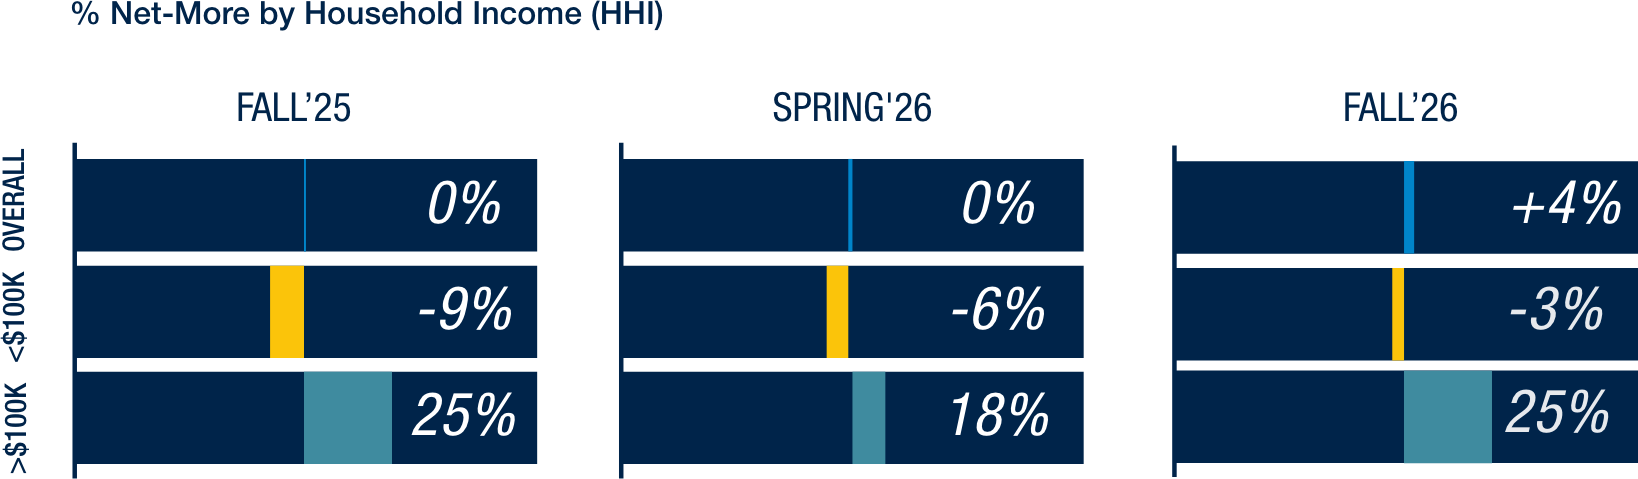
Overall spending intent reached its highest level since Fall ’23. However, this fall, rising spending intent tells two very different stories for higher vs lower-income households.
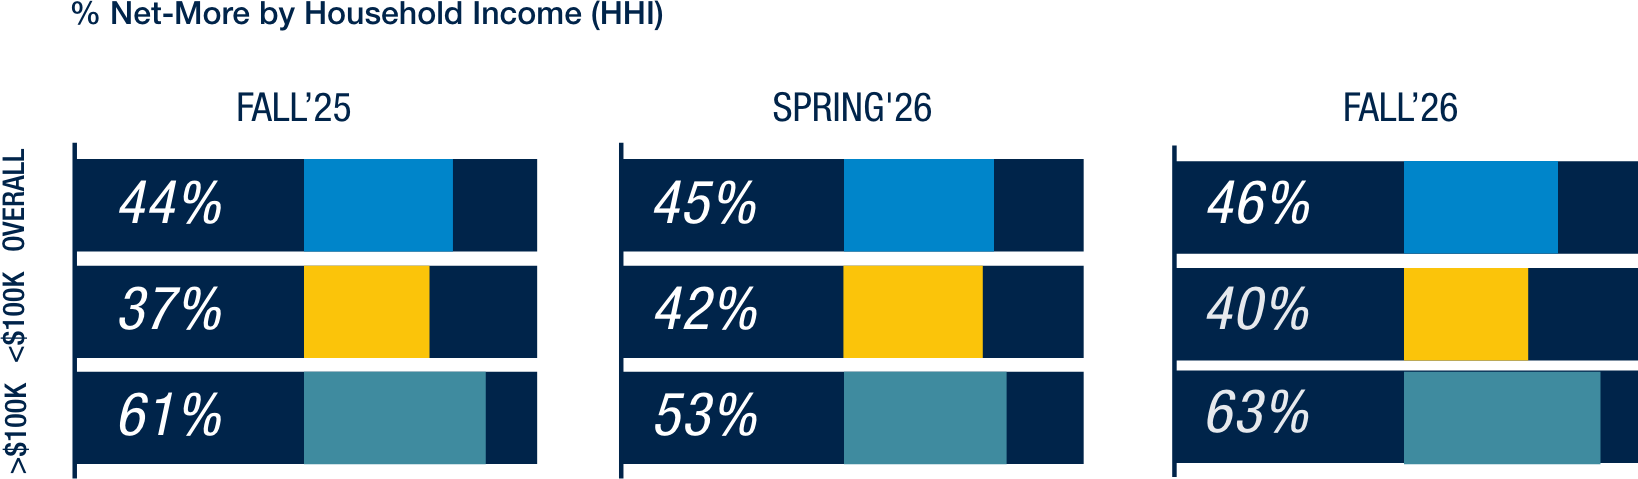
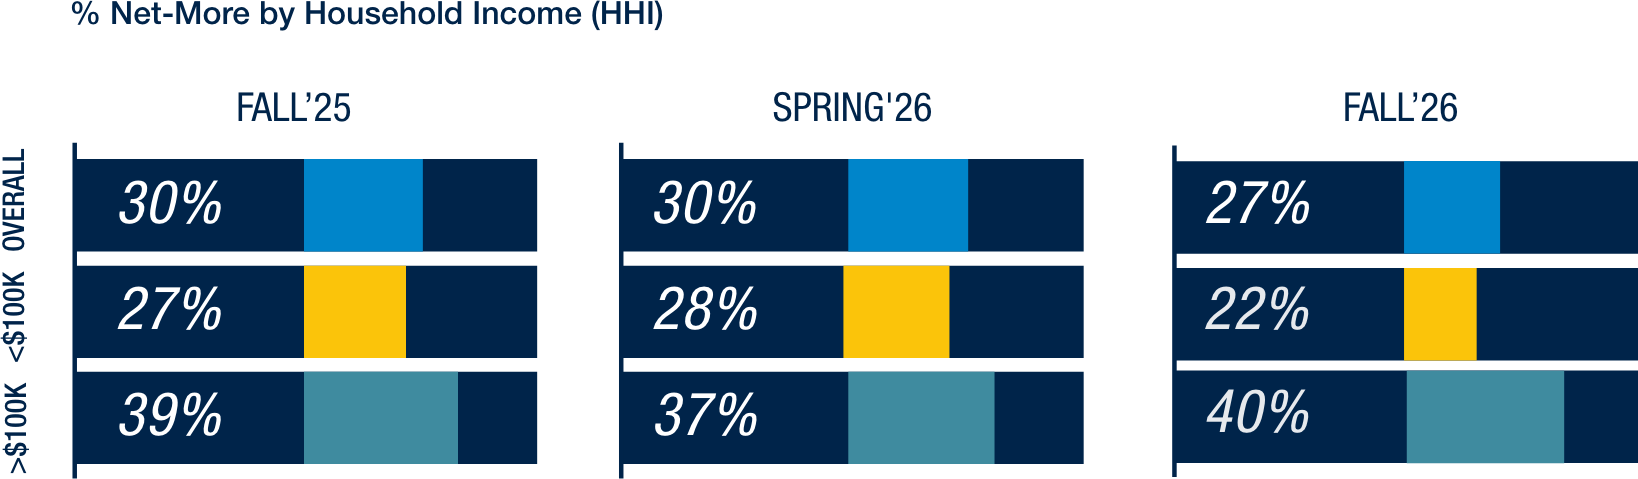
Higher-income households (HHI >$100K) are more optimistic about their earning power than at any point in the past year, net expectation to earn more jumped 10 points to 63%, surpassing Fall’25. They are channeling most of that optimism into spending (+7pts) vs. savings (+3pts).
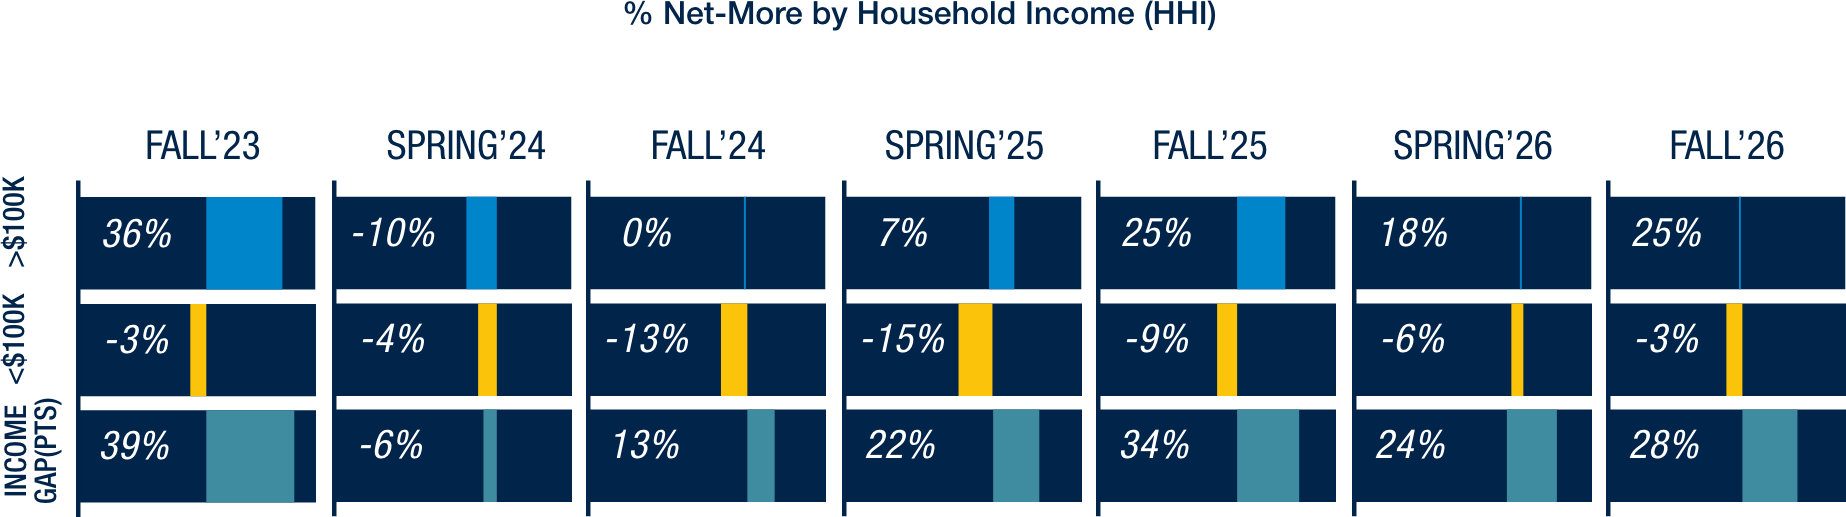
Lower-income households (HHI <$100K) tell an opposite story: earning expectations slipped 2 points to 40%, yet spending expectations still rose 3 points – made possible by a 6 point drop in savings intent to 22%. Worth noting that Groceries are the only category driving higher spend expectation among lower-income households (+7%), suggesting the increase reflects rising essential costs more than renewed appetite for discretionary purchases.
The spending gap between income groups is 28 points (net), wider than in Spring (24 points net) but narrower than a year ago (34 points net). That narrowing is less reassuring than it looks: lower-income households are closing the gap by drawing on savings, not on stronger earnings. As a result, the savings gap has widened to 18 points, the largest since Fall ’23.
Plans to Spend More, Next 6 Months
Consumer Financial Plans for Next 6 Months
- SPEND
- MAKE
- SAVE
Plans to Spend More by Household Income
Category Spending Plans
Grocery Leads The Recovery, But Only Higher Earners Are Adding Spend In Other Categories
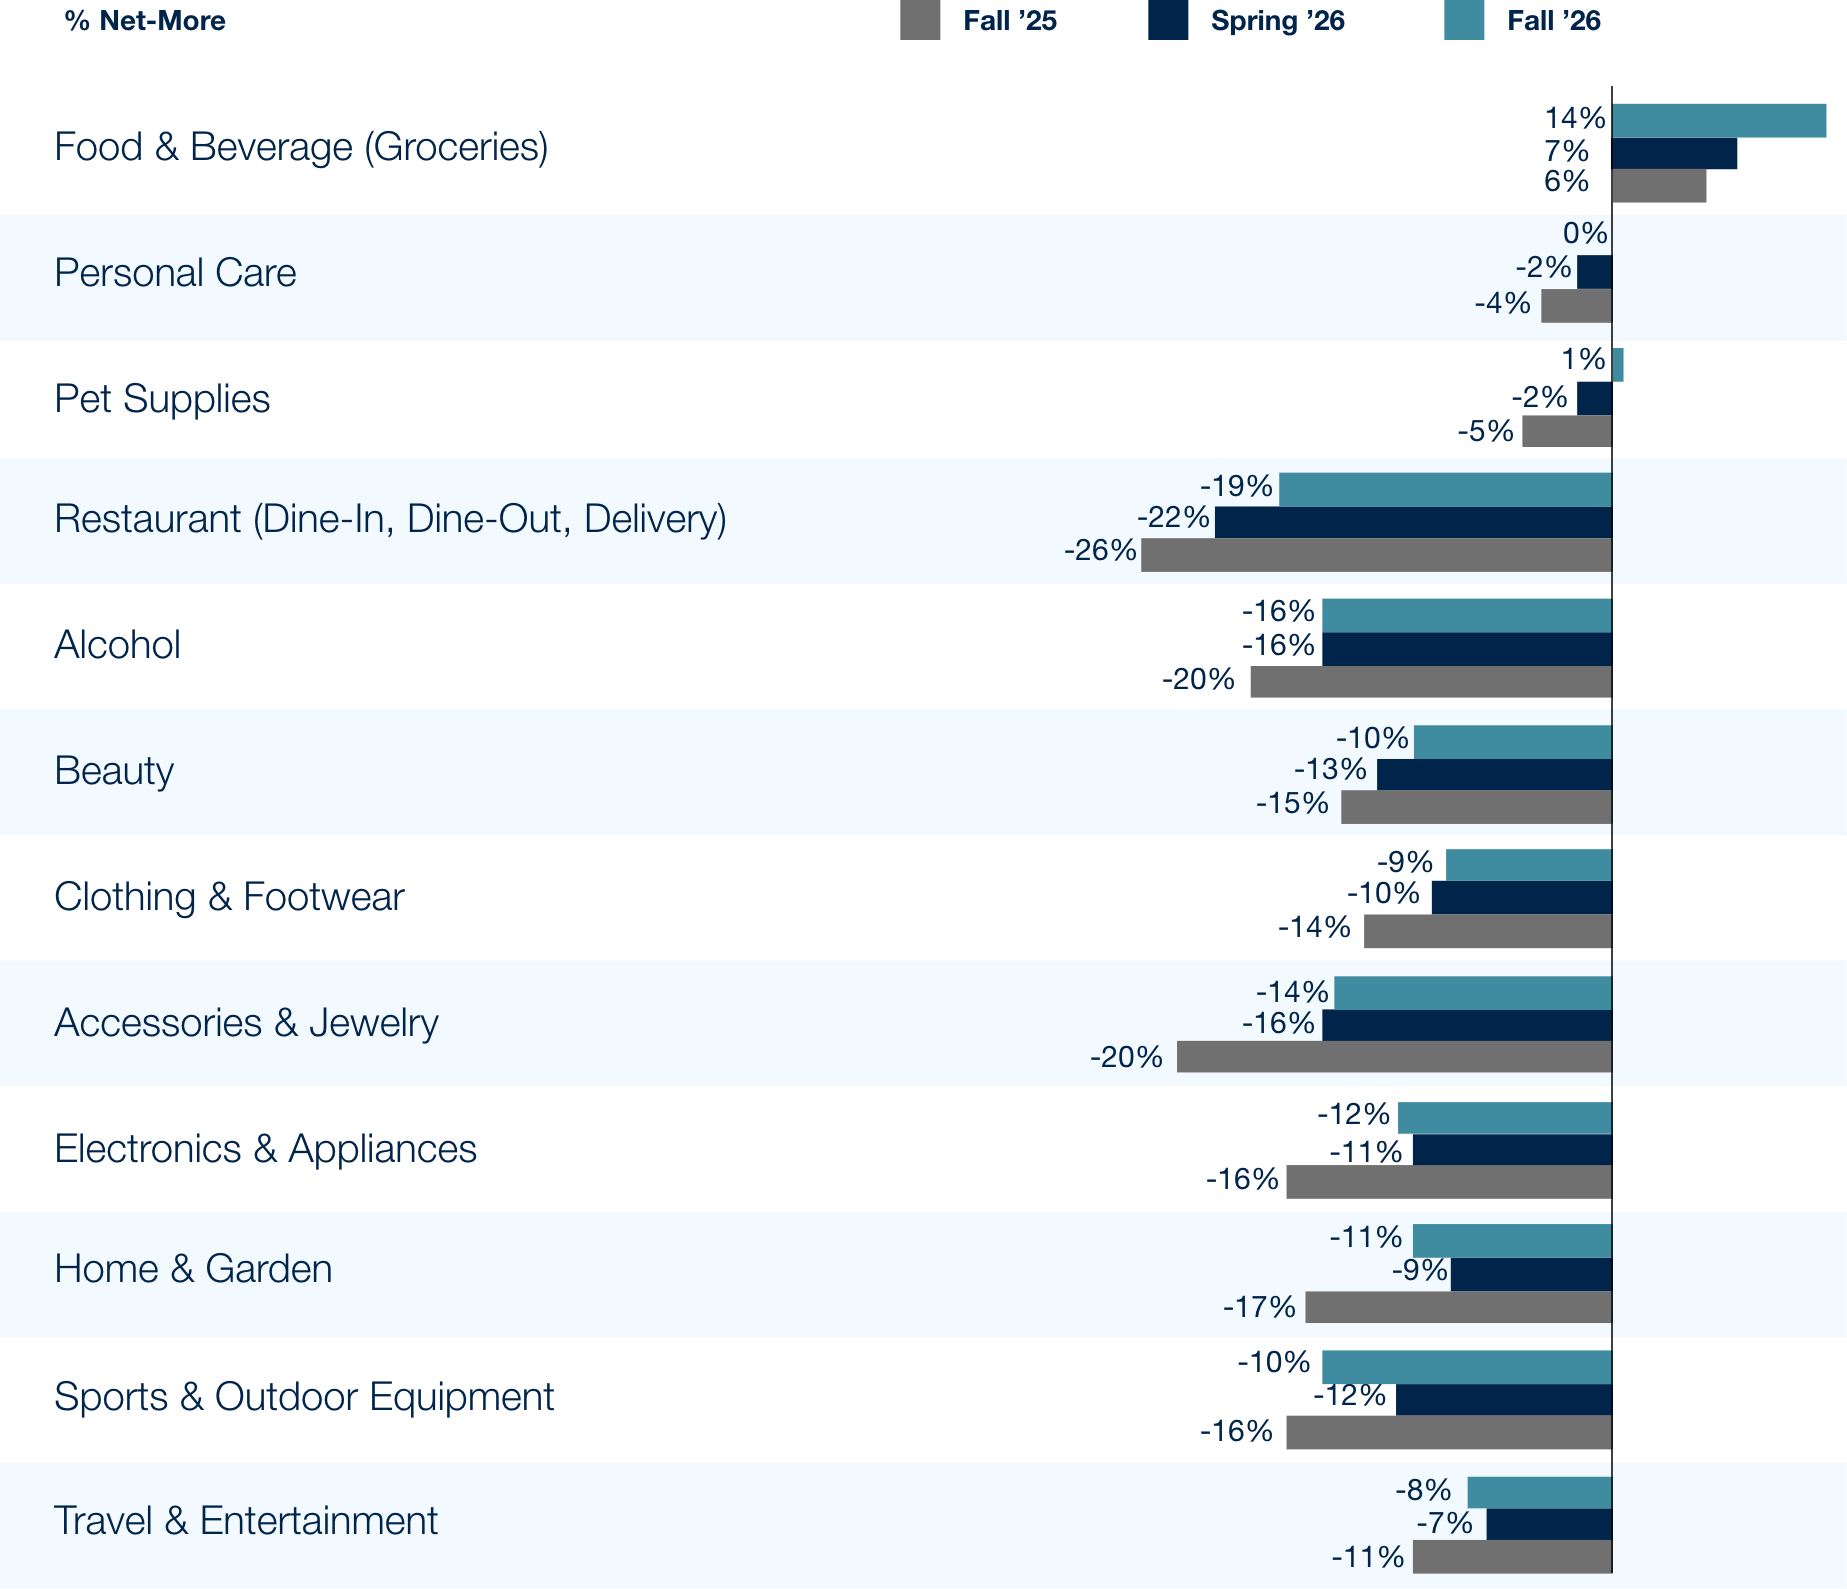
Category spending plans continue to improve from their Fall ’25 lows. Grocery is the clearest priority, with net-more intent nearly doubling to +14%. Discretionary categories remain net-negative, but the pullback is easing, and personal care and pet supplies are now effectively flat.
Beneath the averages, two very different consumers are emerging.
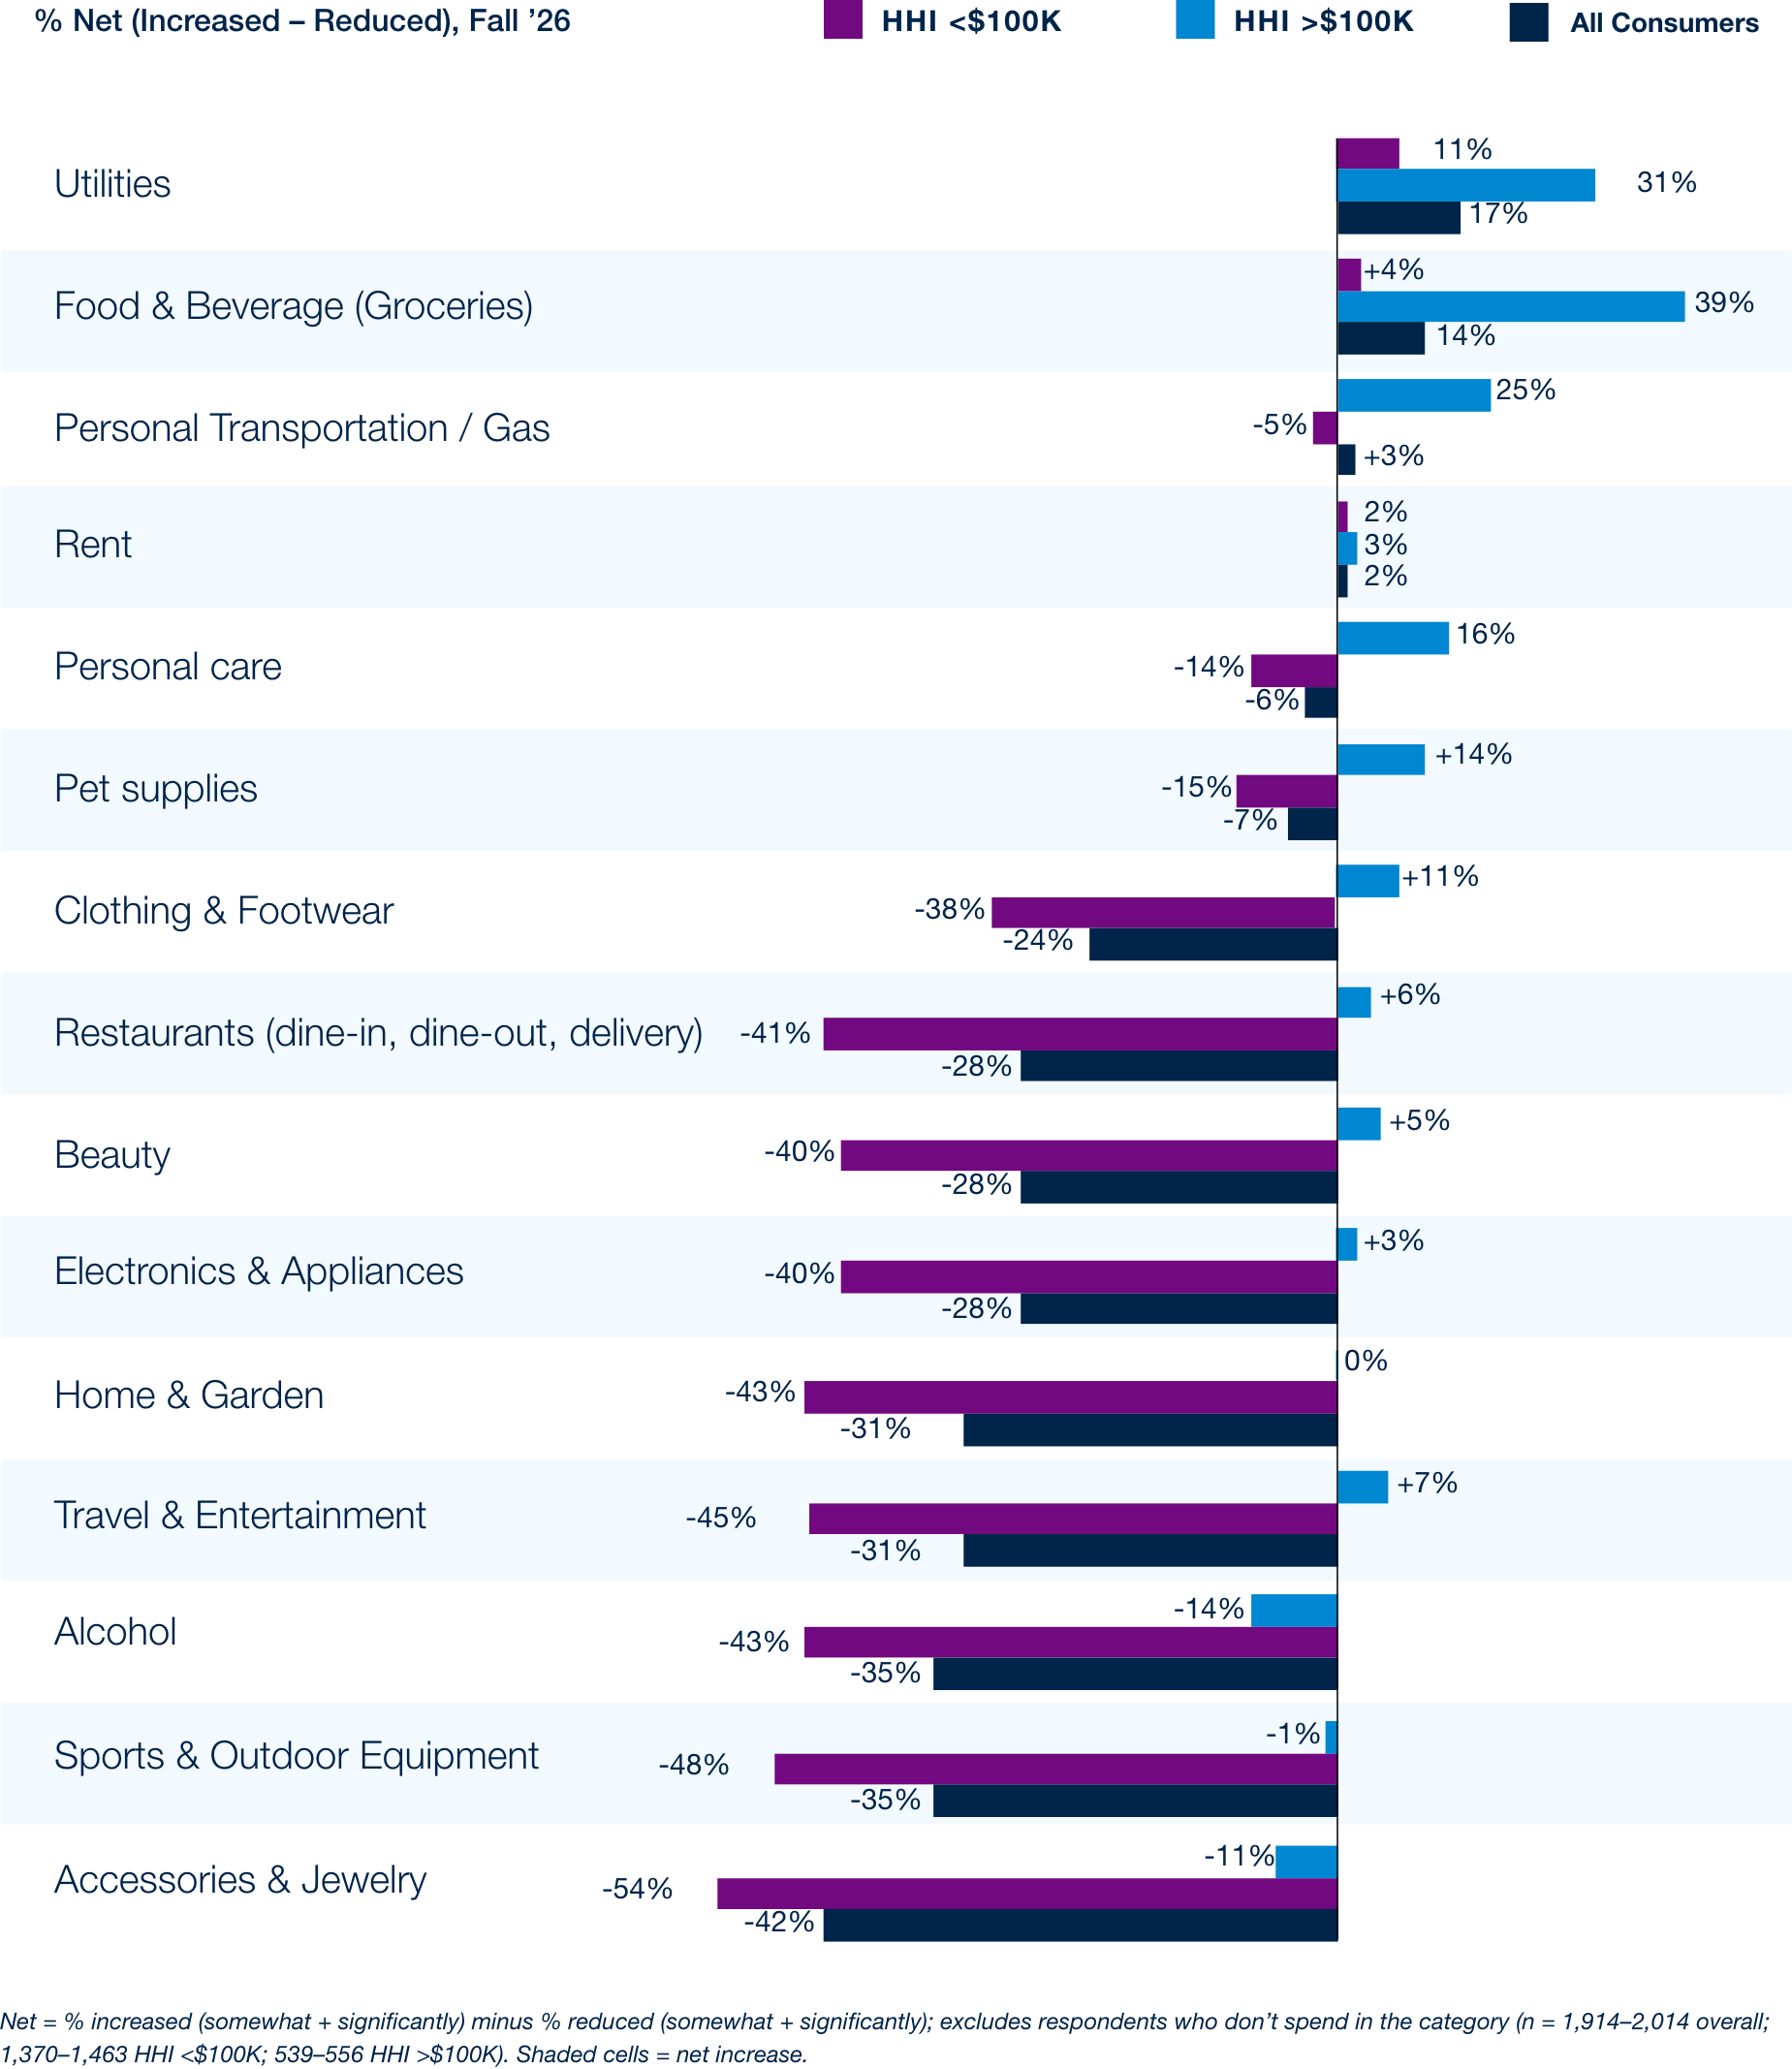
Higher-income households plan to spend more in nine of twelve categories, led by grocery (+33%). Lower-income households remain negative everywhere except grocery (+7%) and pet supplies (flat), with gaps of 24-37 points versus higher-income consumers in restaurants, clothing, and travel.
Recent behavior tells a similar story. Over the past six months, consumers report net increases in spending on utilities (+17%), groceries (+14%), gas (+3%), and rent (+2%) — the only categories with net increases. Among lower-income households, utilities stand out (+11%), as essential costs absorb budget that might otherwise go to discretionary categories.
Consumer Spending Plans by Category
–Next 6 Months
Actual Spending — Past 6 Months
Holiday Season
A TWO-SPEED HOLIDAY: HIGHER-INCOME HOUSEHOLDS SPEND MORE ON MOST HOLIDAY CATEGORIES WHILE LOWER-INCOME HOUSEHOLDS CUT BACK ACROSS THE BOARD
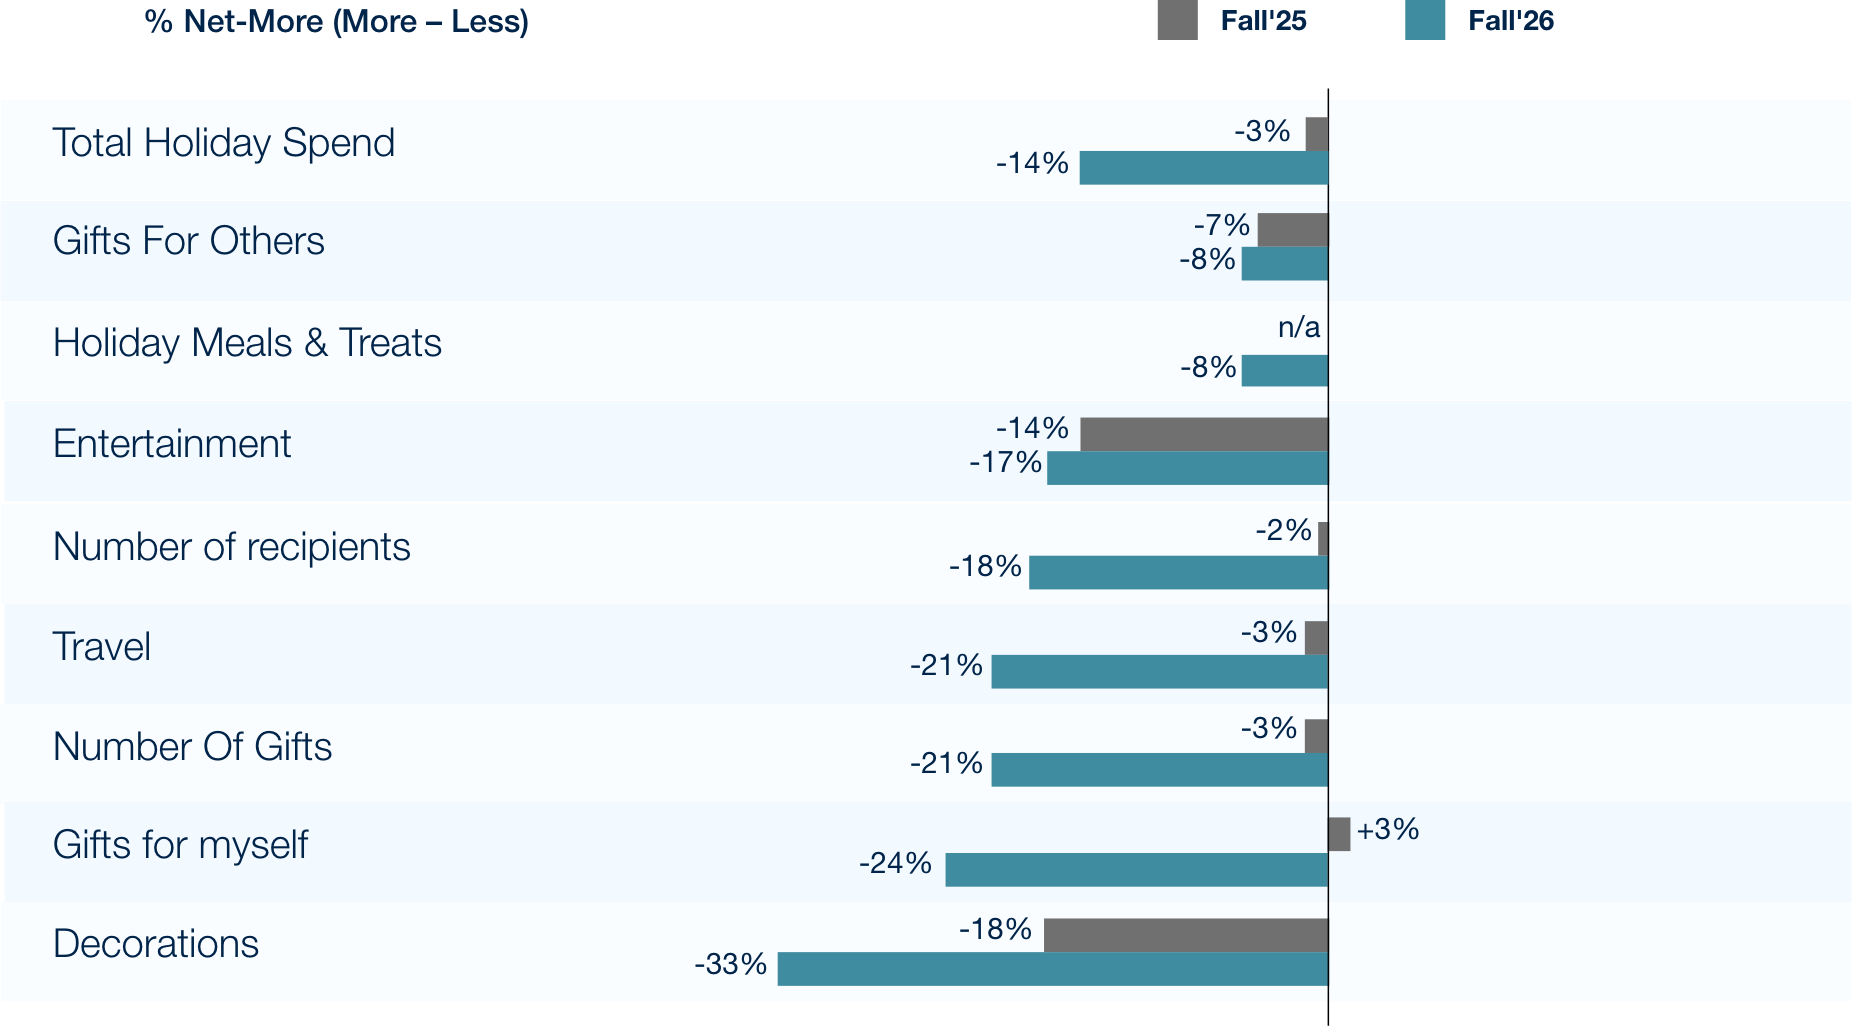
Consumers are planning a leaner holiday. Total holiday spending intent is -14% net-more, a clear deterioration from roughly -3% last fall. However the overall number hides a sharp divide by income, mirroring the dynamics observed in non-holiday spending.
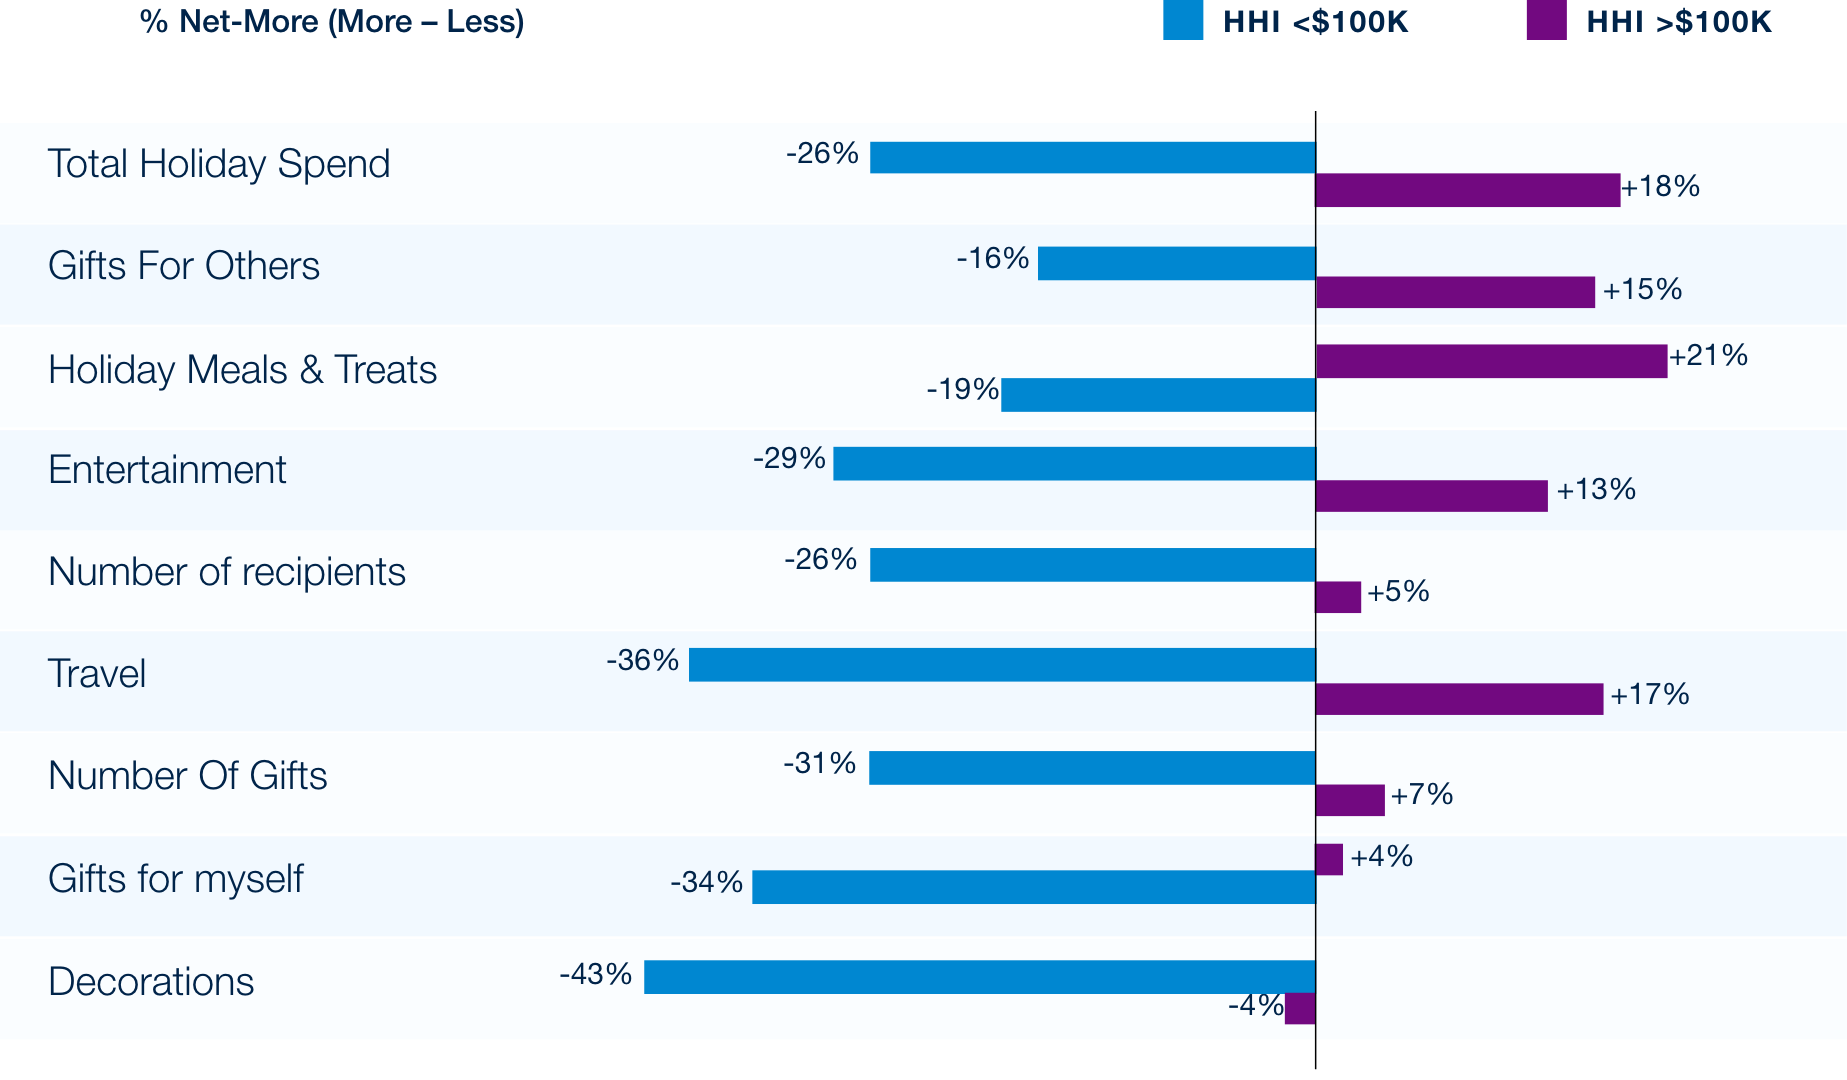
Higher-income households are applying their stronger earnings expectations to the holidays, planning to spend more (+18% net), led by holiday meals and treats (+21%) and travel (+17%). Their spending on themselves goes to meals, treats and experiences rather than gifts for themselves, which are only modestly up (+4%). Decorations are the only category where higher-income households plan to pull back (-4%).
For lower-income households, the holidays are another place to cut back, consistent with their tight budgets in everyday spending. They plan to spend less in every holiday category (-26% net). The cuts are somewhat shallower for gifts for others (-16%) and holiday meals (-19%) than for gifts for themselves (-34%), travel (-36%) and decorations (-43%), but all remain deeply negative. The pullback is also steeper among consumers aged 45 and over (-32%), while under-45s are roughly flat (+3%).
This split helps reconcile our findings with industry forecasts of 4-5% holiday sales growth. Dollars are likely to rise with prices and affluent spending, even as most households plan to do less.
Plans to Spend This Holiday Season vs. Last Year
Consumer Spending Plans By Household Income
Shoppers Will Time Purchases Around Promotions, But Won’t Risk Missing The Must-Have Gift
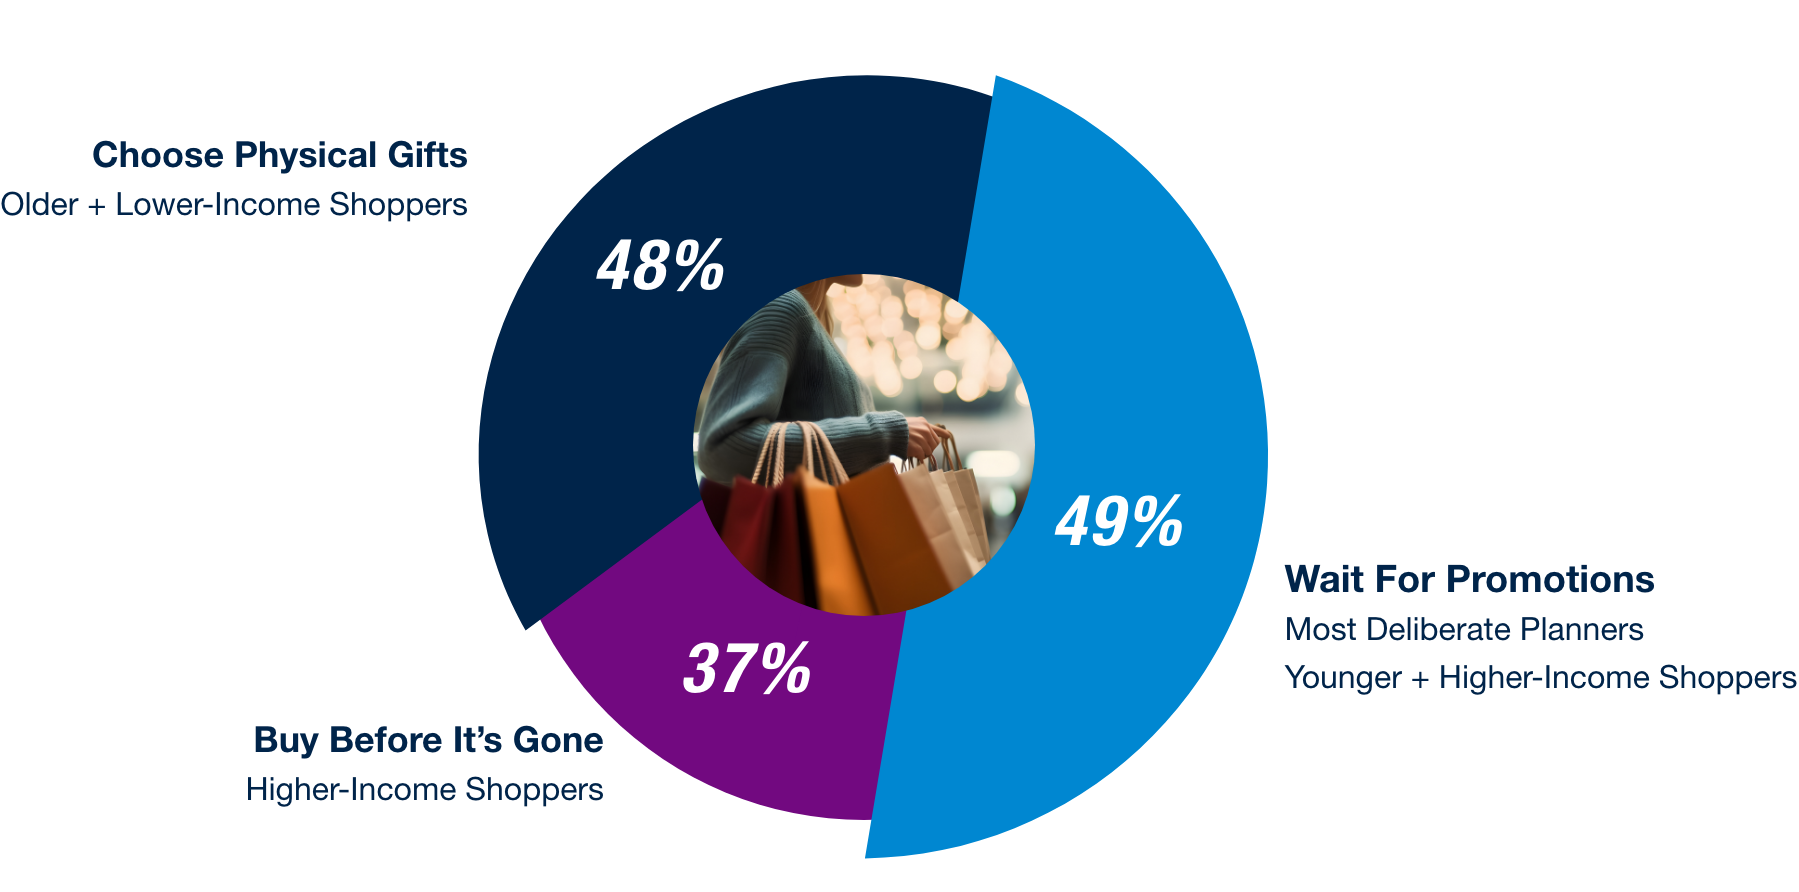
Promotions remain central to holiday planning. About half of consumers (49%) wait for events like Black Friday or Cyber Monday, at least for big-ticket items. Higher-income and younger shoppers are the most deliberate planners.
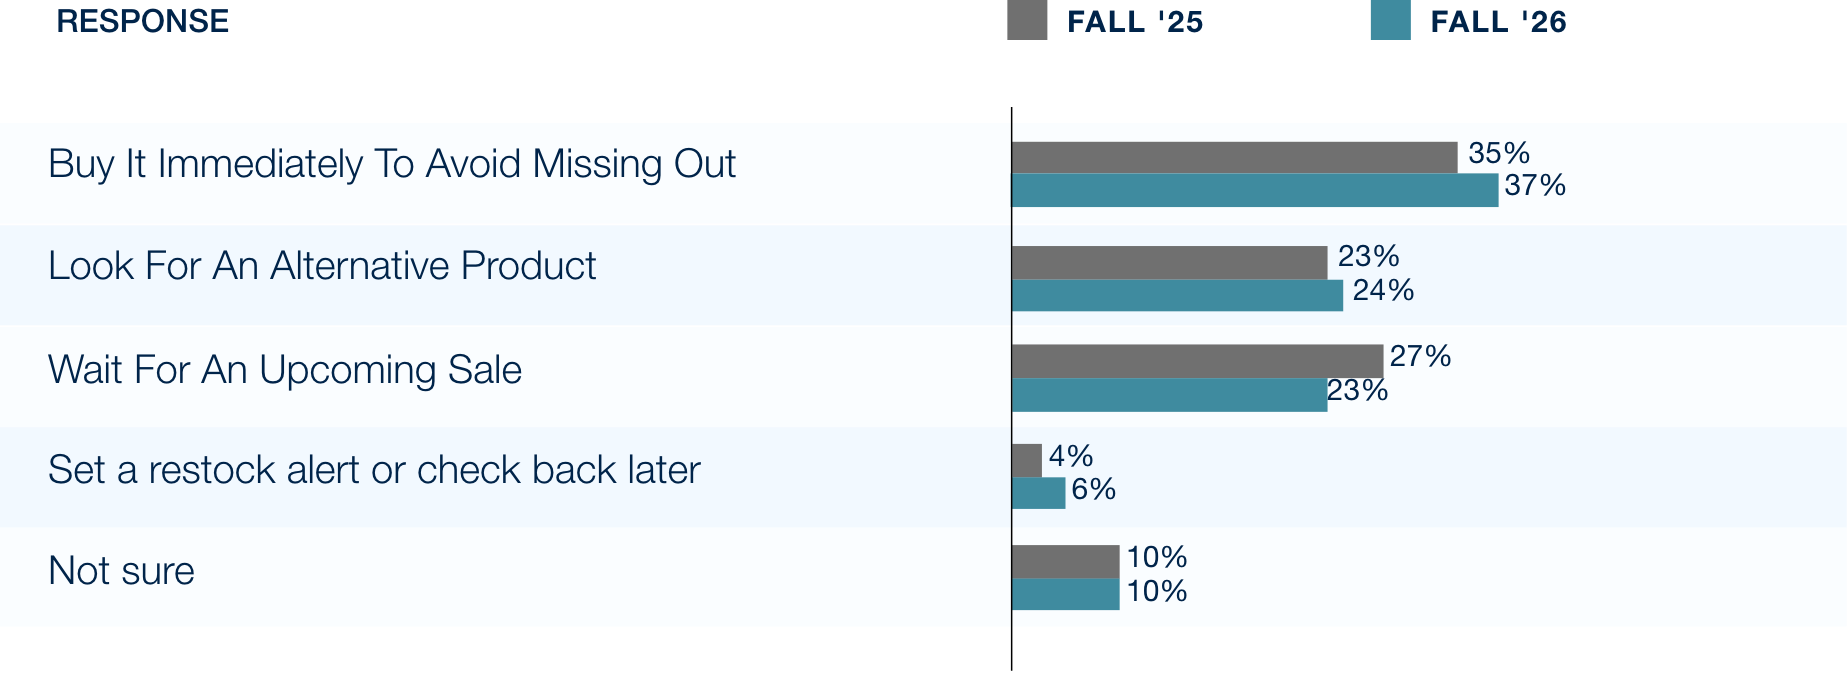
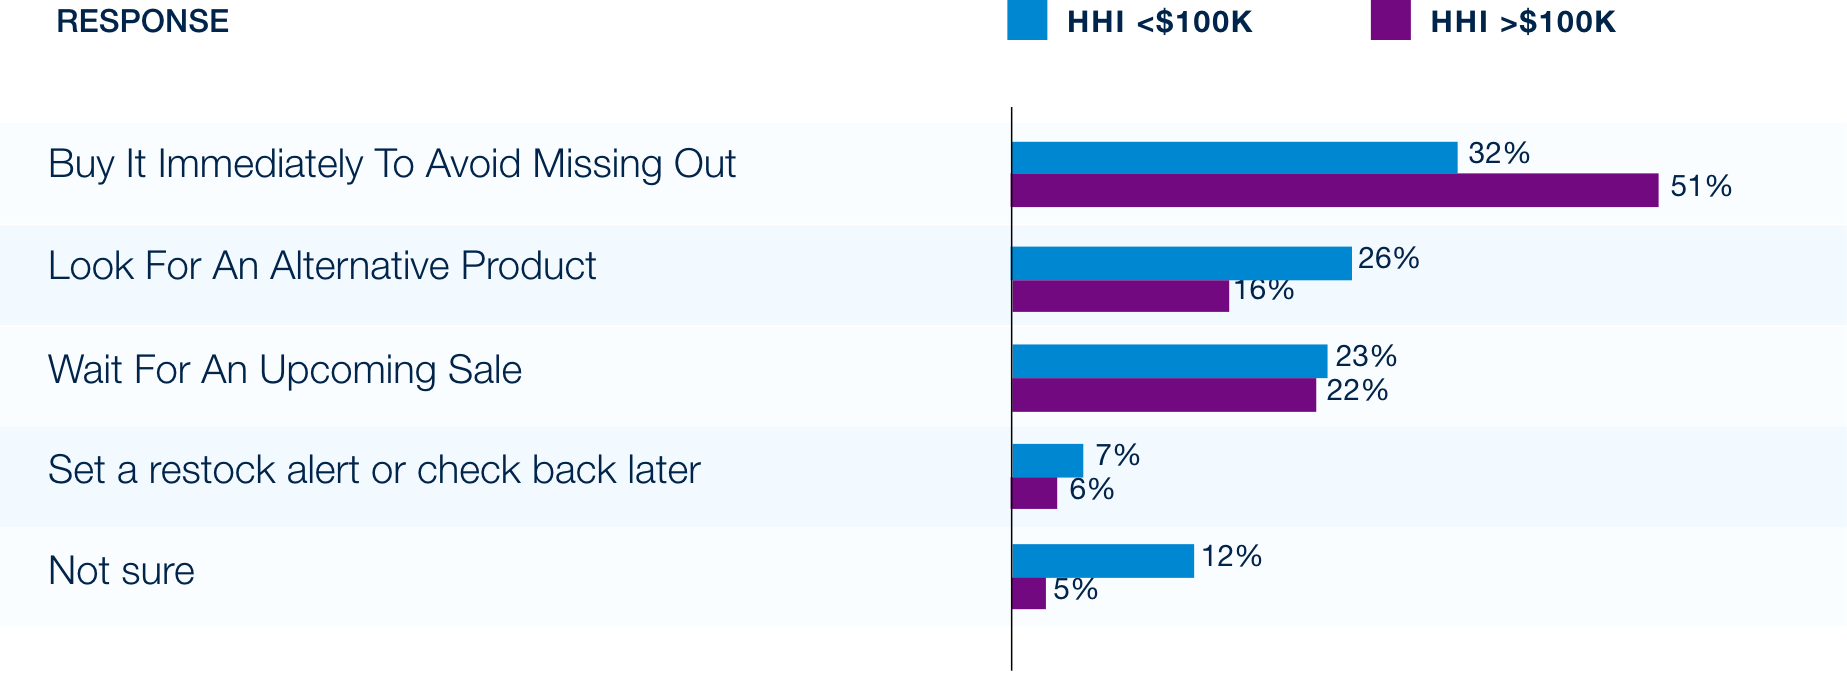
Yet when a desired gift is running low, urgency wins. More consumers would buy immediately to avoid missing out (37%), while fewer would wait for a sale. Higher-income shoppers are especially decisive, while lower-income shoppers are more likely to look for an alternative. For retailers, in-stock position on key items may matter as much as price this season.
Gifting preferences split by life stage and income. Physical gifts are the most common choice (48%),
but gift cards appeal more to older and lower-income shoppers, while experiences resonate with younger and higher-income consumers. Channel plans lean digital, with more consumers planning to shop online than in-store.
If A Desired Gift Is Low In Stock, Consumers Would Most Likely…
Response By Household Income
Value Without Compromise | Grocery
THE SHIFT TO LOWER-PRICED GROCERS IS STICKING – AND SHOPPERS NOW SEE LITTLE TRADE-OFF IN EXPERIENCE
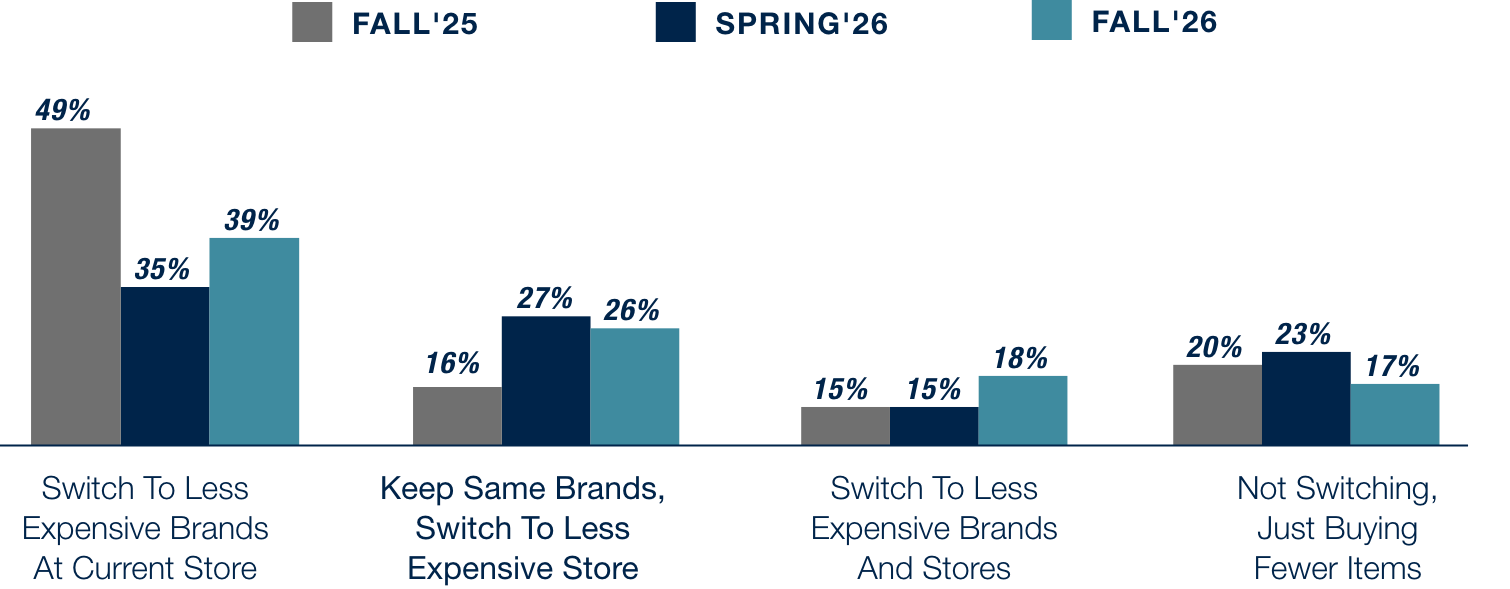
Grocery shoppers are still looking for value, and how they do it has settled into a new pattern. Among those planning to spend less, switching to cheaper brands at their current store is the most common approach (39%), while fewer plan to simply buy less. The retailer trade-down that emerged in the spring has held: 26% plan to keep their brands but move to a less expensive store, up from 16% last fall.
Store switching skews higher-income and younger. Higher-income households are twice as likely as lower-income households to keep their brands and change stores (43% vs. 22%), while lower-income and older shoppers lean on brand trade-down and buying less.
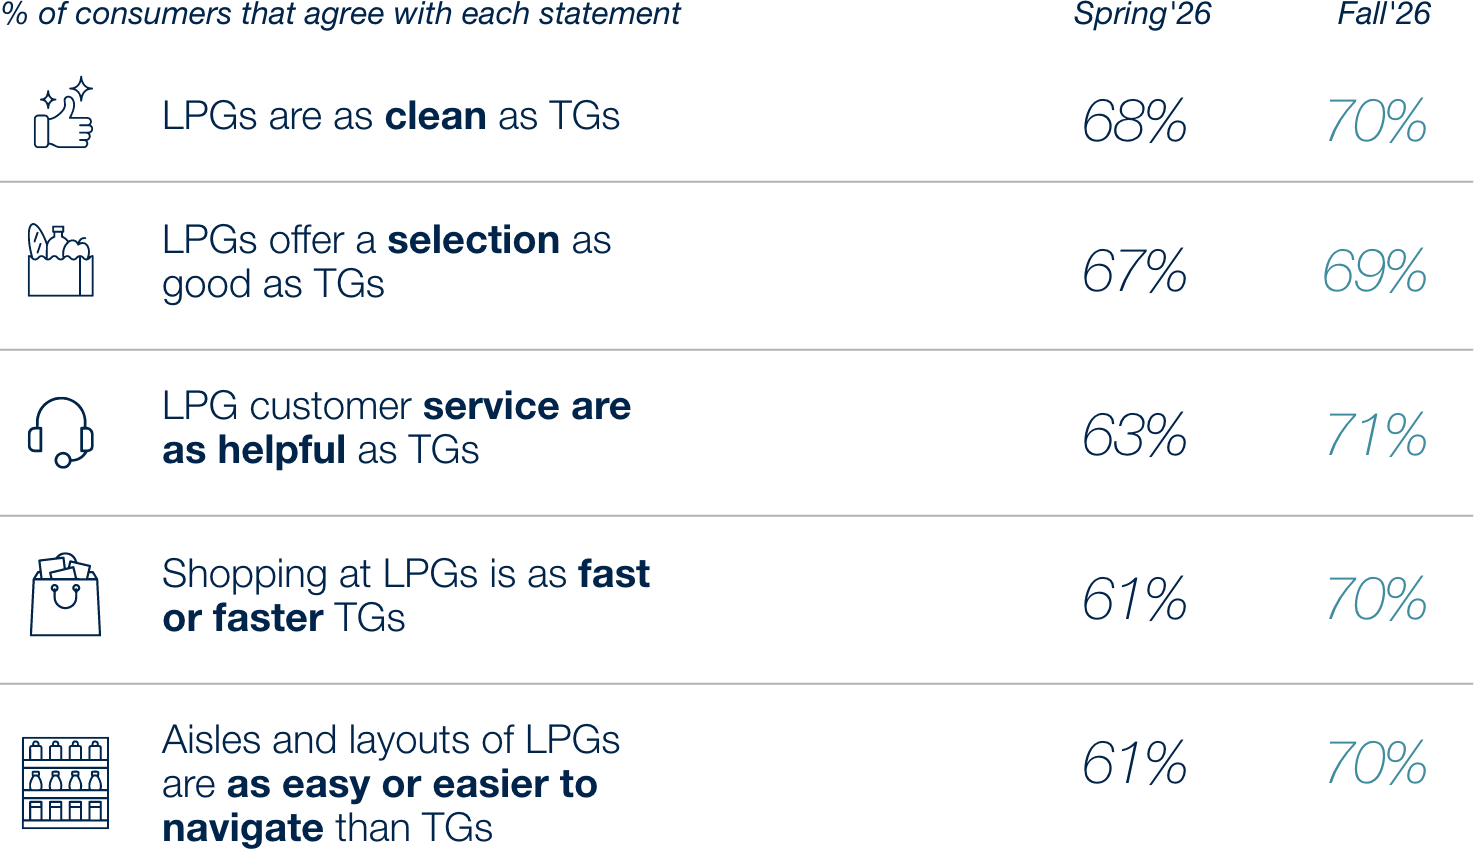
The switch is sticking because the experience gap has closed. Seven in ten consumers now agree that lower-priced grocers match traditional supermarkets on every dimension measured, with the biggest gains in customer service, shopping speed, and navigation.
Consumer Perception of Lower Price Grocers
(LPG) vs Traditional Grocers (TG)
Consumer Approach to Reducing Grocery Spend
(among those planning to spend less)
STORE BRANDS ARE MAINSTREAM AND QUALITY PERCEPTION IS STRENGTHENING, LED BY HIGHER-INCOME AND YOUNGER SHOPPERS
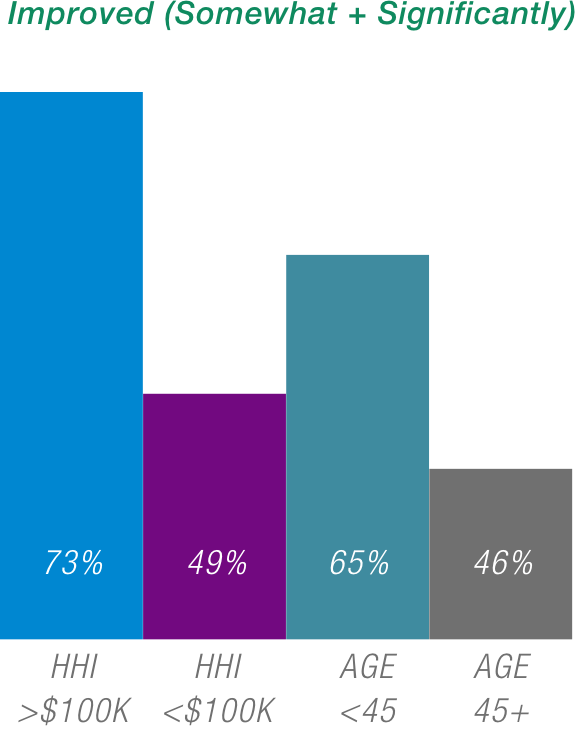
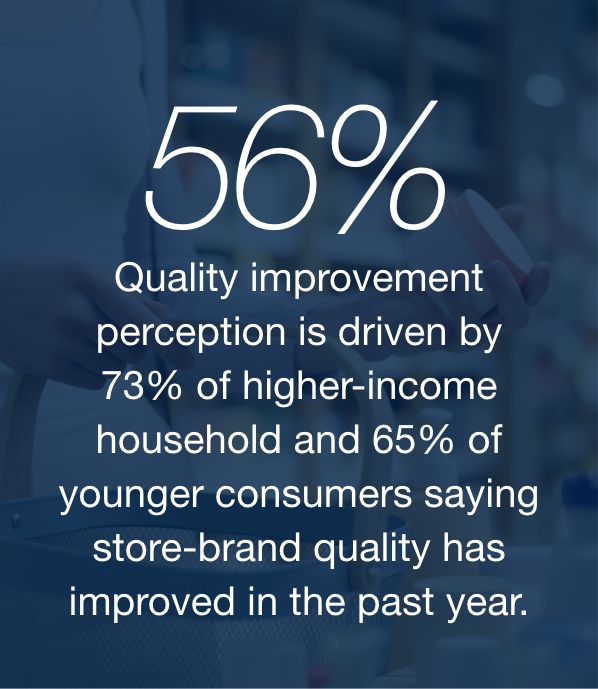
Store Brand usage is mainstream (77% buy store brands somewhat or very often). Quality improvement perception (56%) is driven by 73% of higher-income household and 65% of younger consumers saying store-brand quality has improved in the past year.
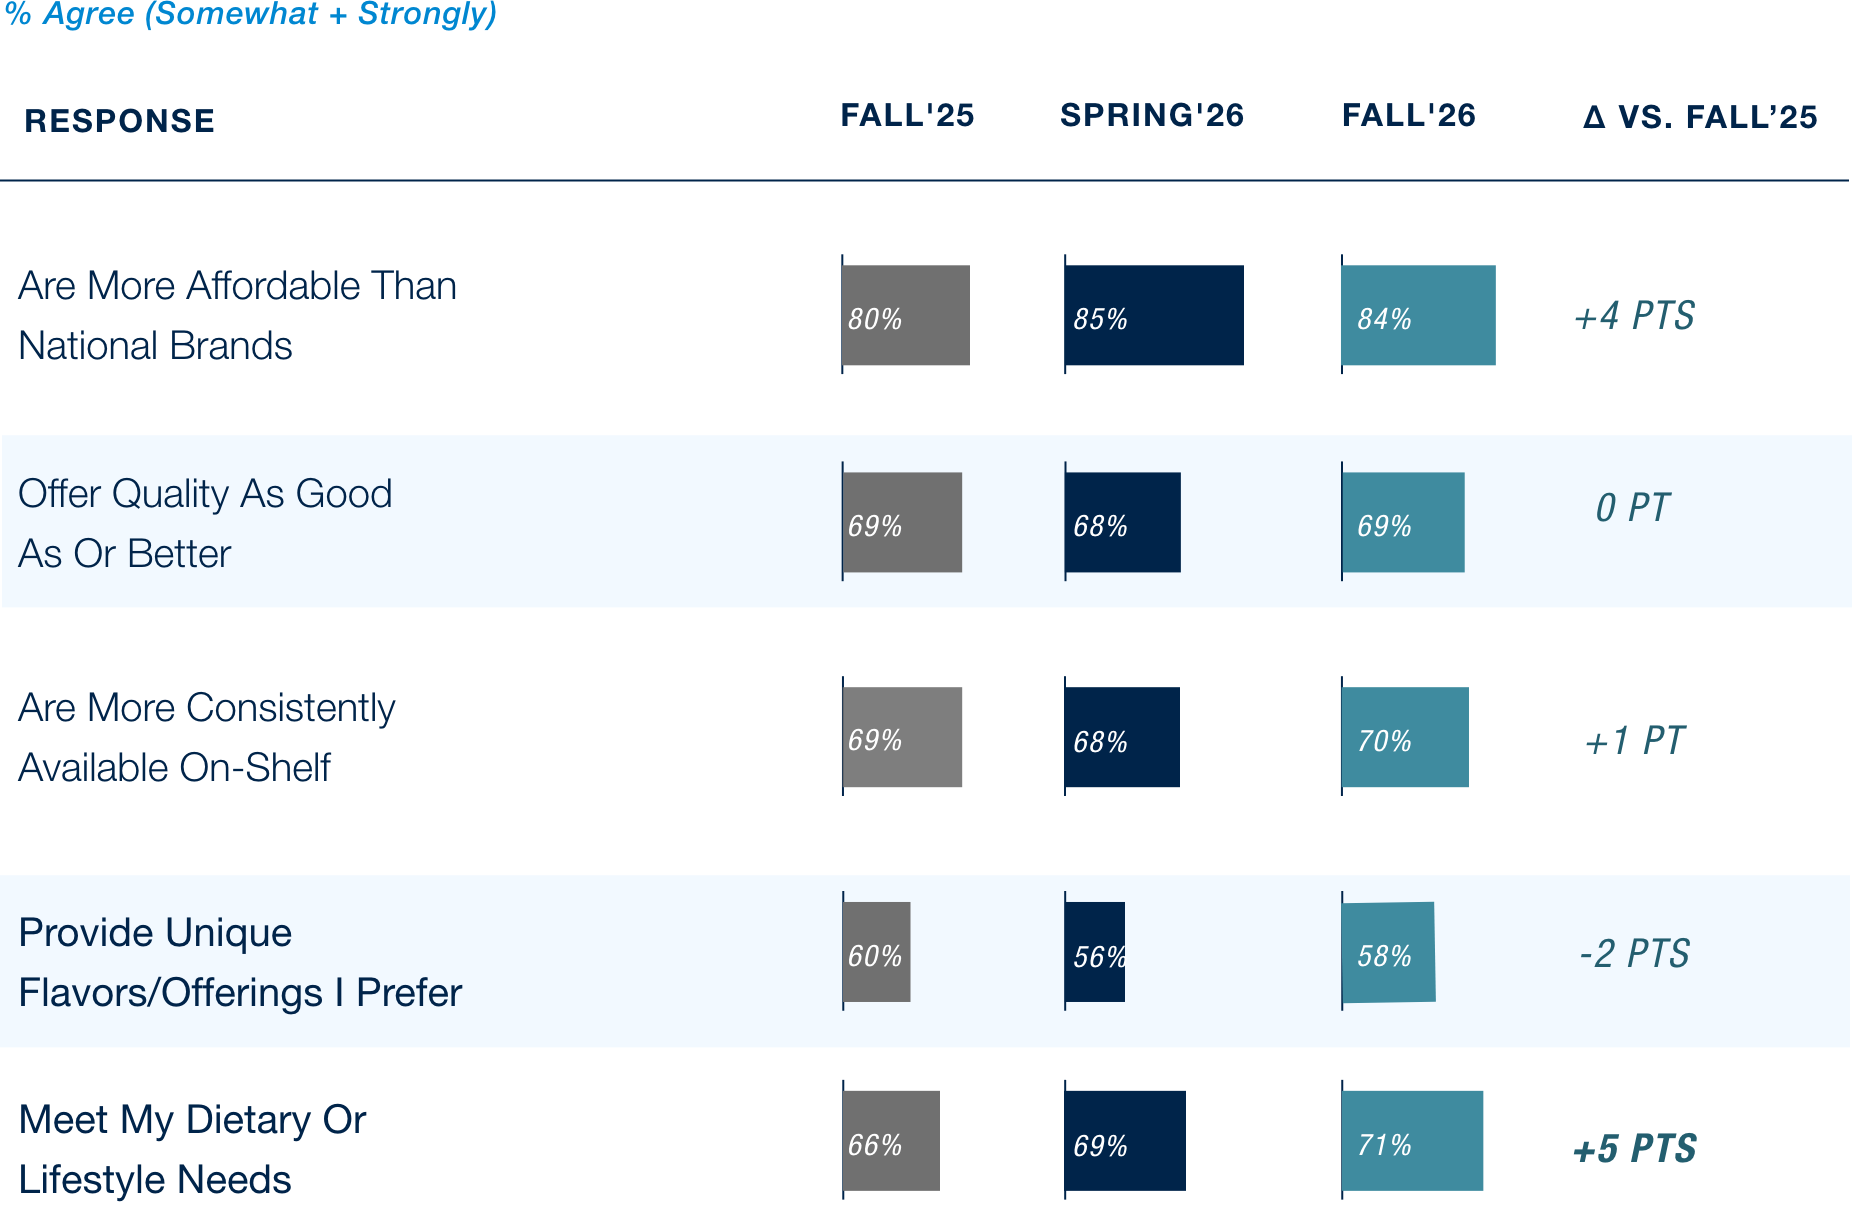
Year-over-year movement on specific perception attributes vs national brands is modest but remain strong. Price remains the anchor: 84% of households agree that store brands are more affordable than national brands (+4pts vs Fall’25). Quality, availability and flavor perception are relatively stable but remain strong, in Fall’26 69% say store brands offer quality as good as or better than national brands, 70% say they are more consistently on shelf and 58% say it provides unique flavors/offers they prefer.
Interestingly, the % of households that say store brands fits their dietary or lifestyle needs has increased from 66% in Fall’25 to 69% in Spring’26 and to 71% in Fall’26 potentially reflecting Store Brands efforts to tailor their offering to evolving USA consumer diets driven by increased GLP1 usage.
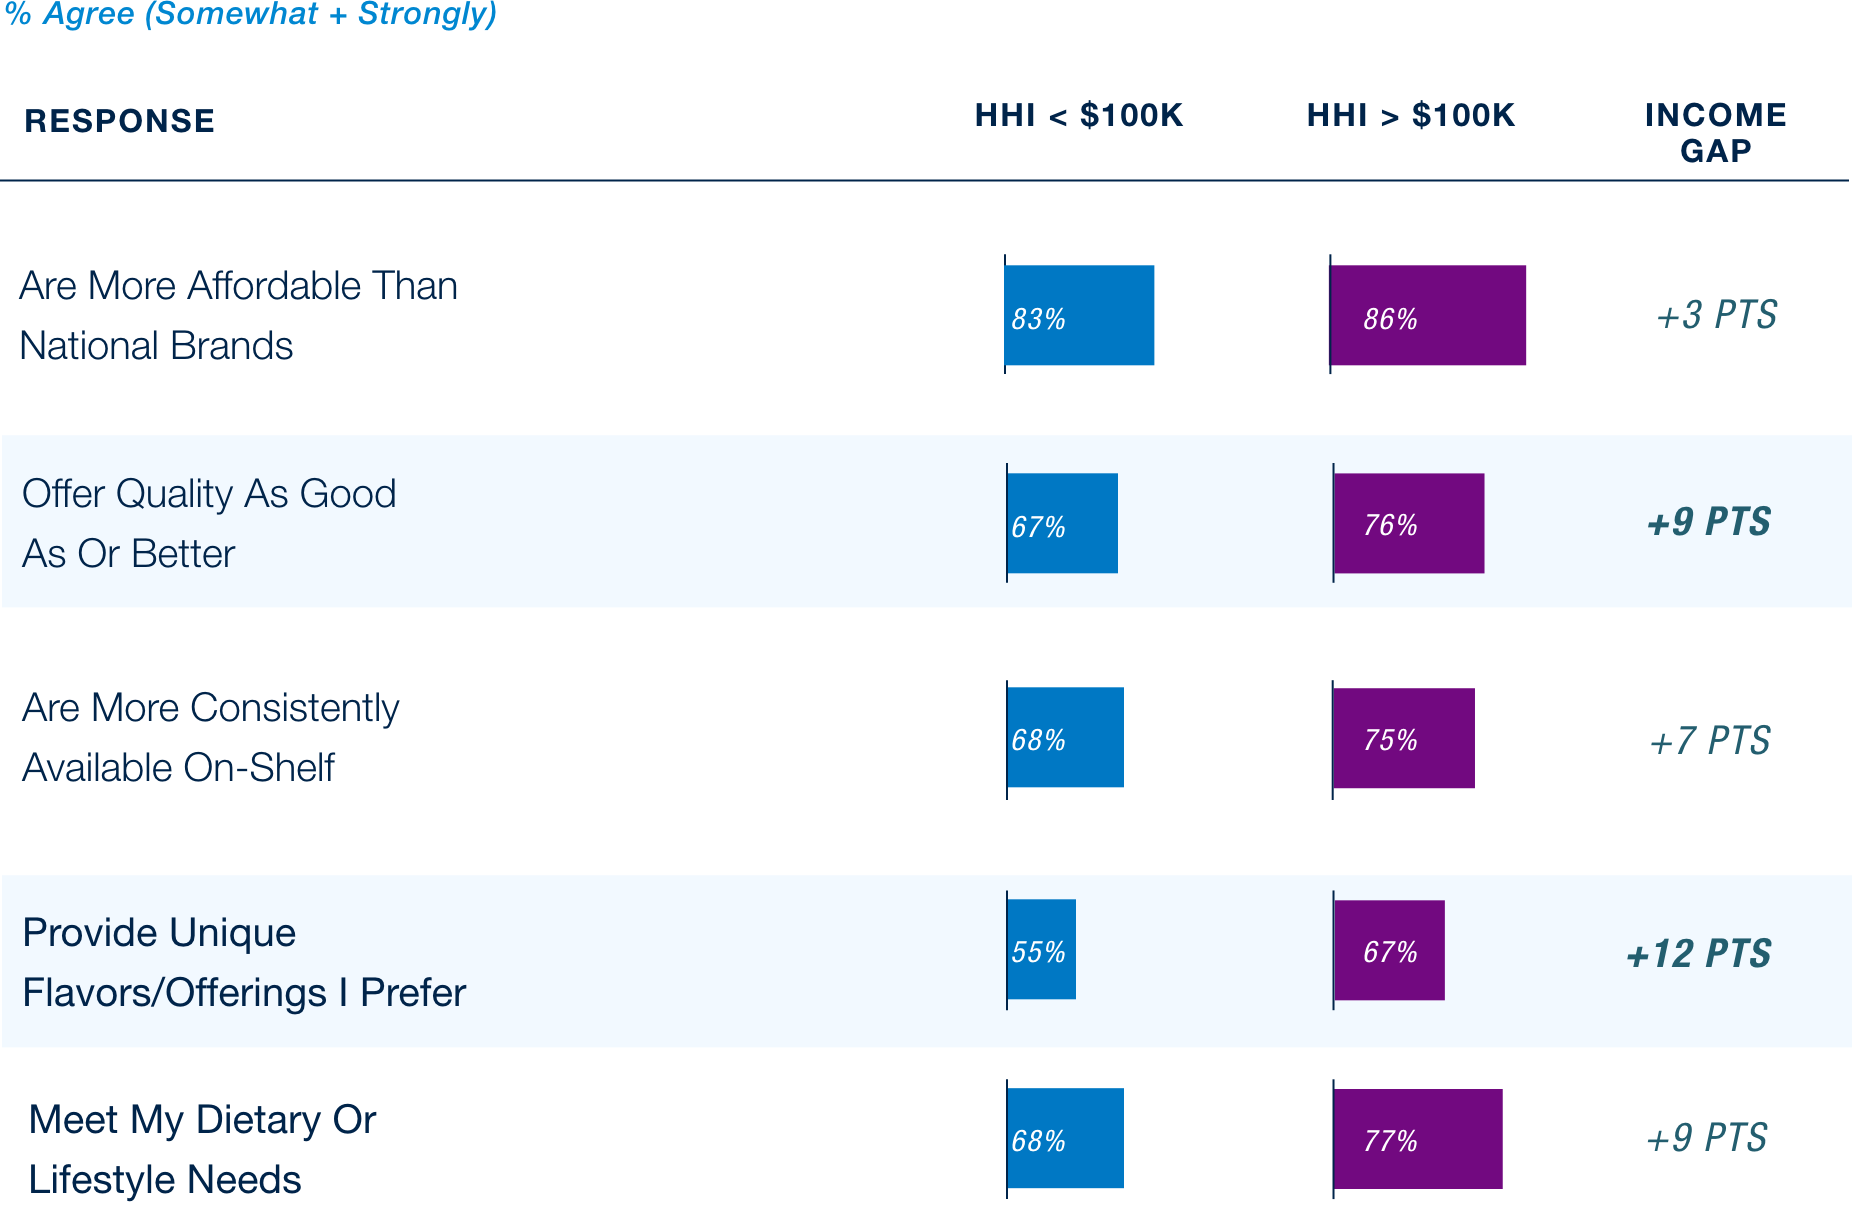
Households above $100K lead on every dimension, most sharply on unique offerings (+12 pts) and quality (+8 pts), and are far more likely to say quality has improved (73% vs. 49%).
Store Brand vs National Brand Perceptions
Response by Household Income
INGREDIENTS WIDEN THEIR LEAD OVER TASTE AS THE REASON TO PAY MORE; SNACK DATA SUGGESTS IT MEANS “WHAT’S IN IT”
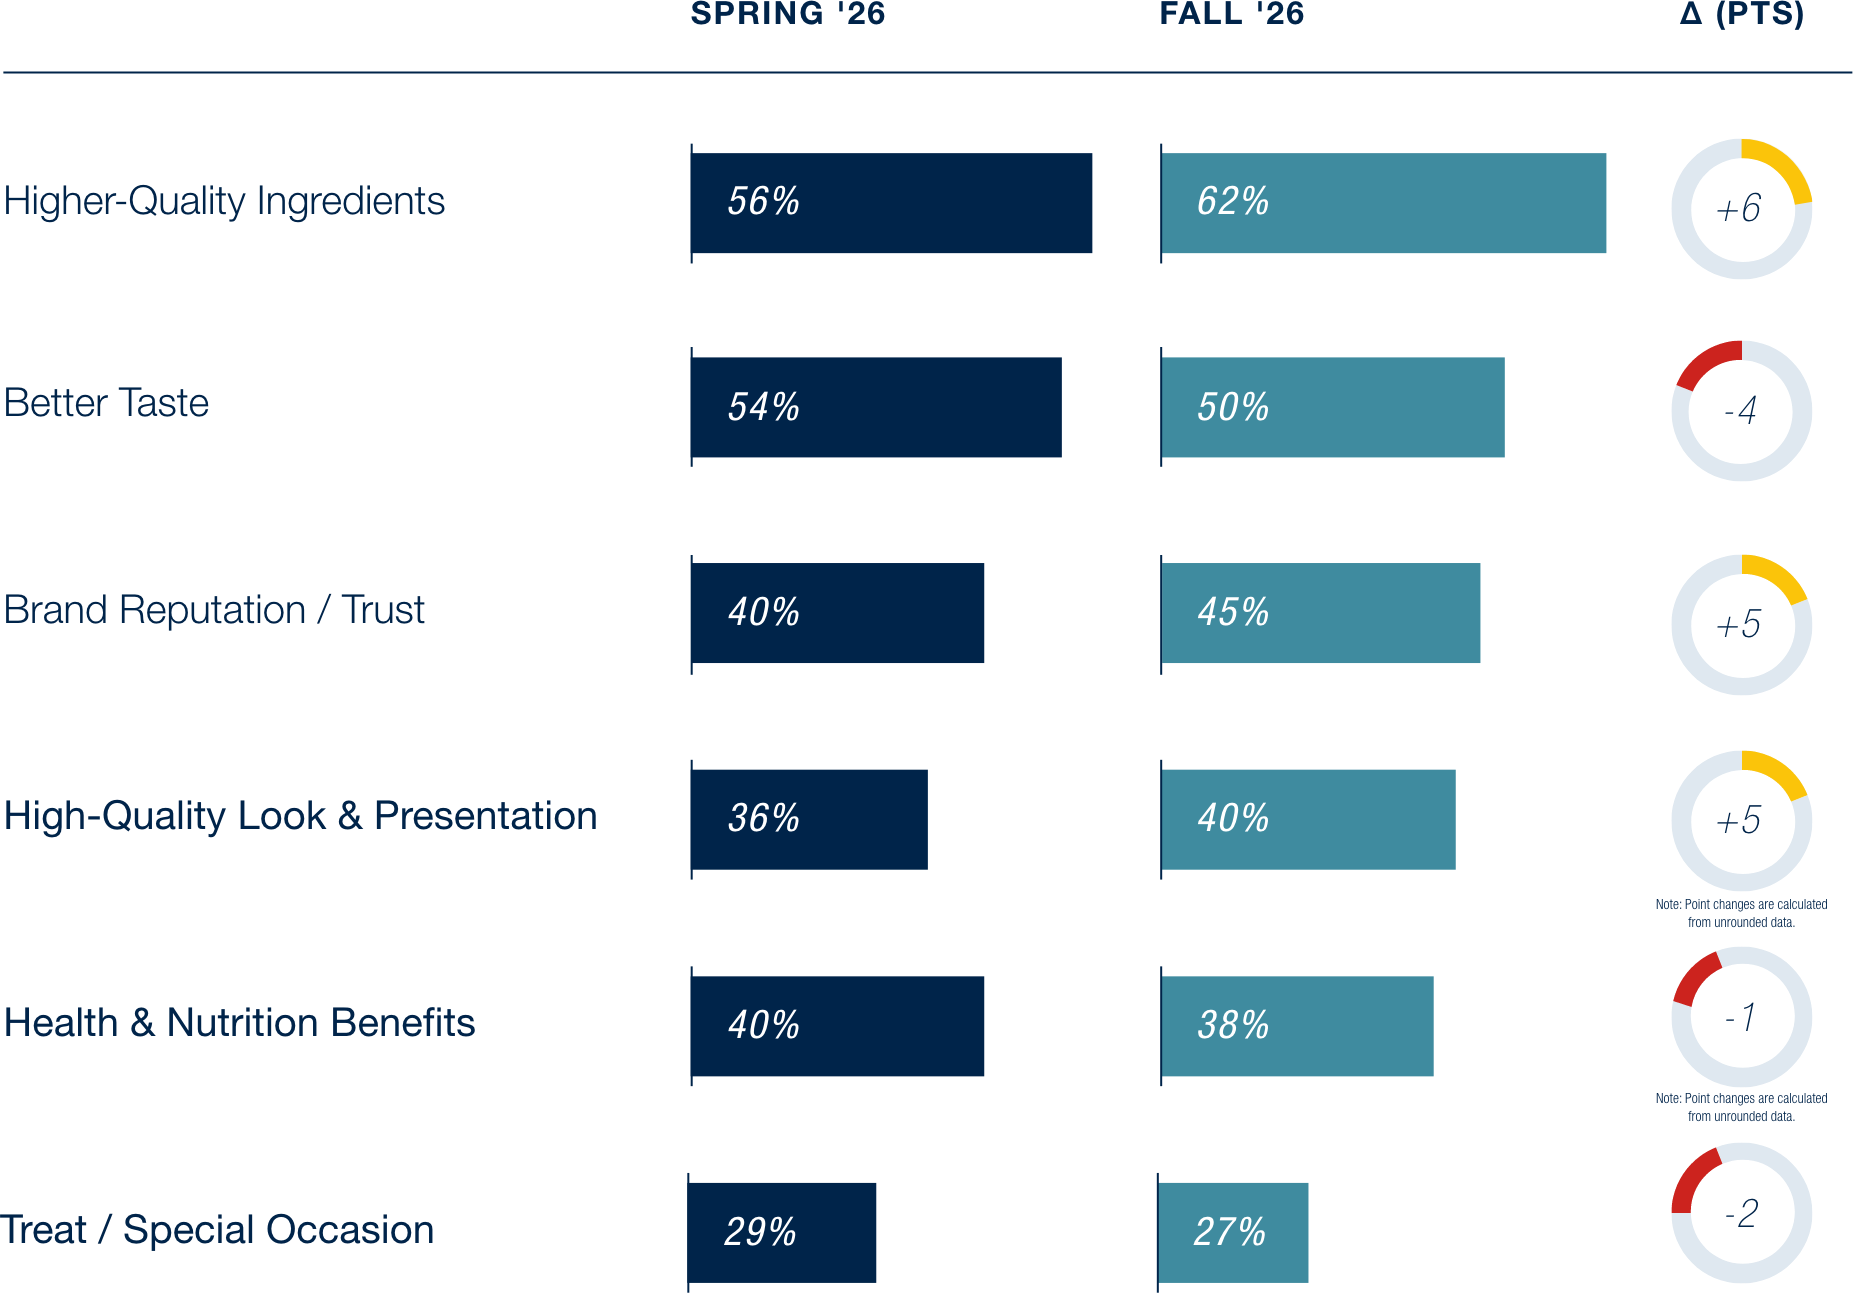
Among shoppers who frequently buy higher-priced grocery brands, higher-quality ingredients is the clearest driver of paying more, rising 6 pts to 62% in Fall ’26. Ingredients already edged out taste in Spring (56% vs. 54%), and the lead has now widened to 12 pts. Brand reputation/trust (+5 pts) and look and presentation (+5 pts) also gained ground, while taste (-4 pts) and health and nutrition (-1 pt) eased slightly. Quality cues are gaining importance rather than taste losing relevance: half of premium buyers still cite taste as a reason to pay more.
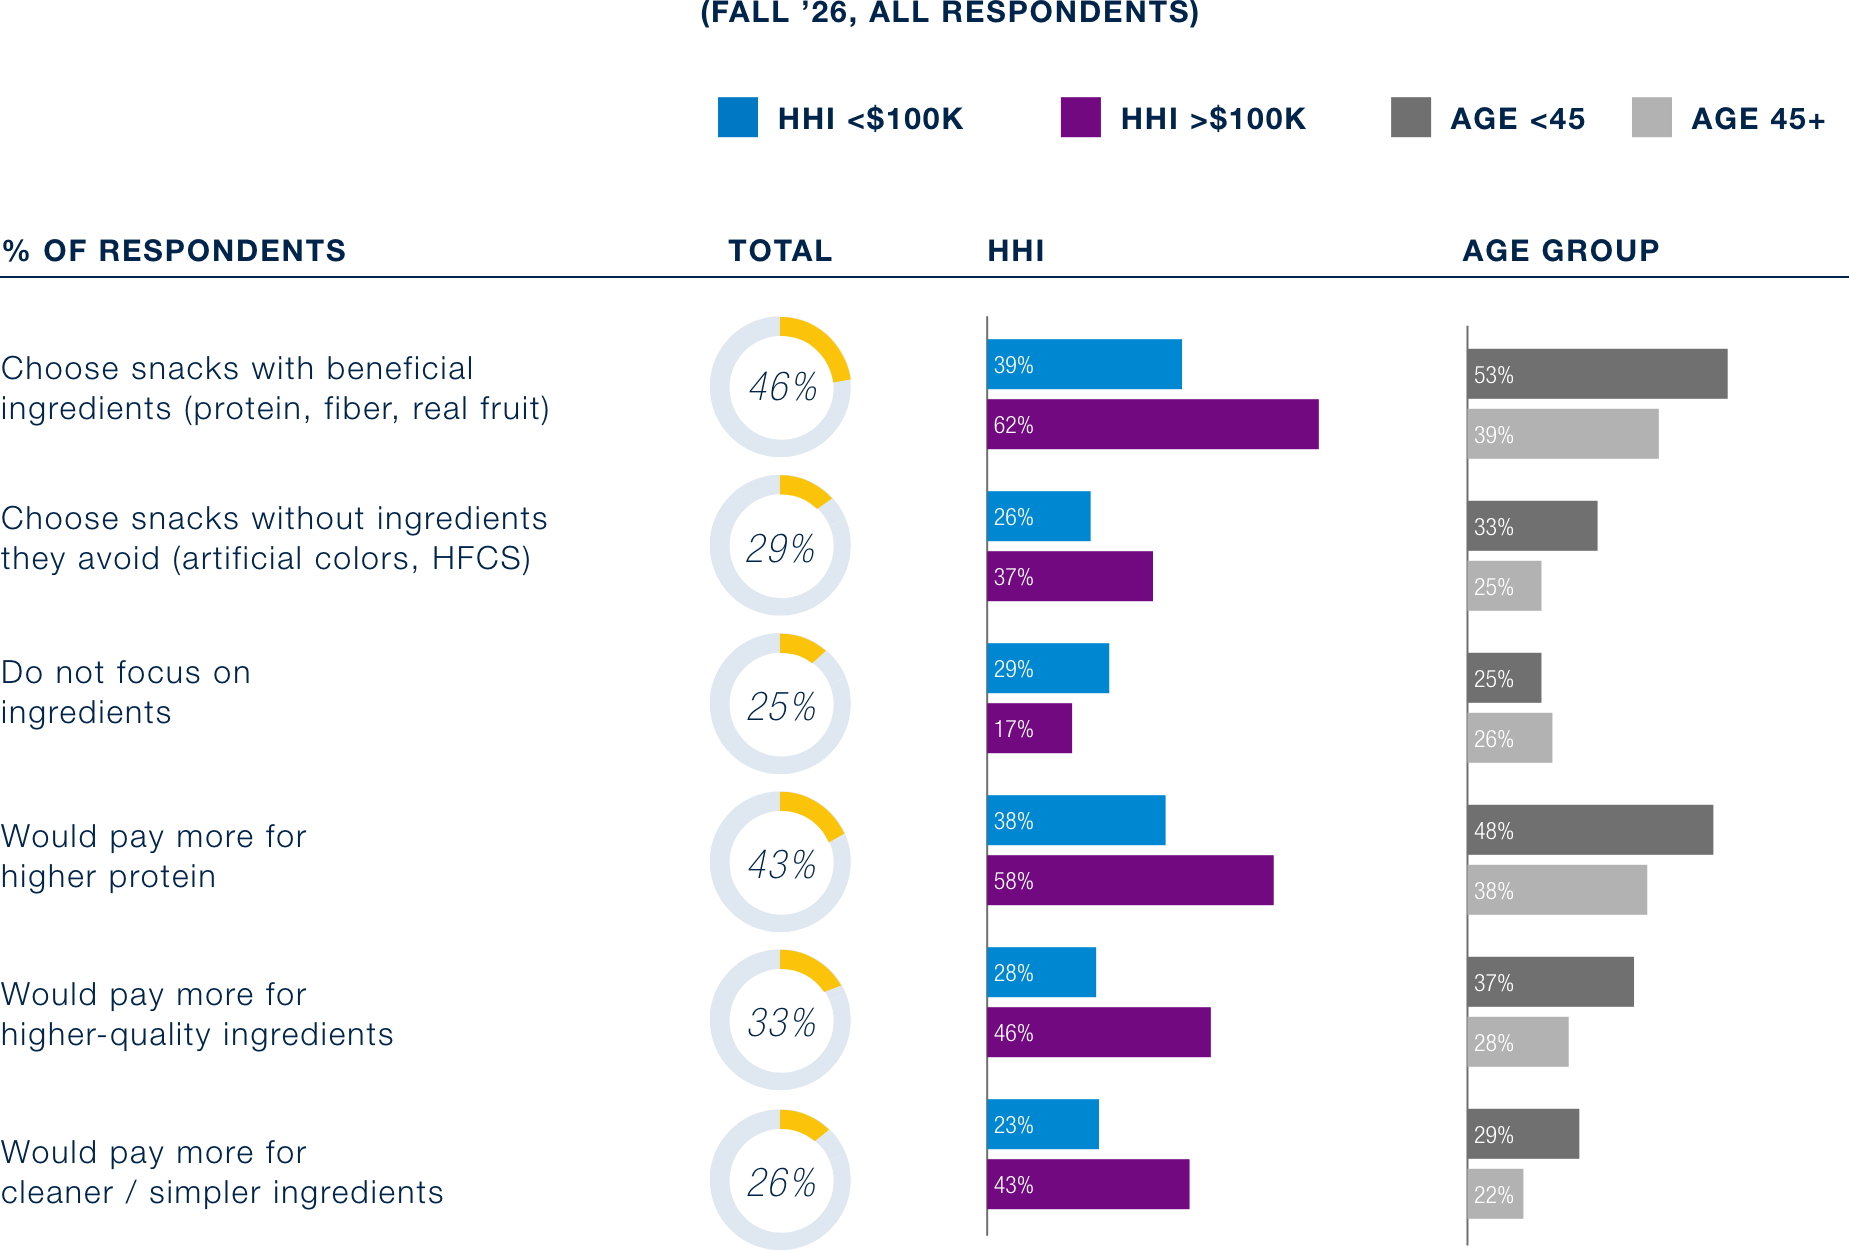
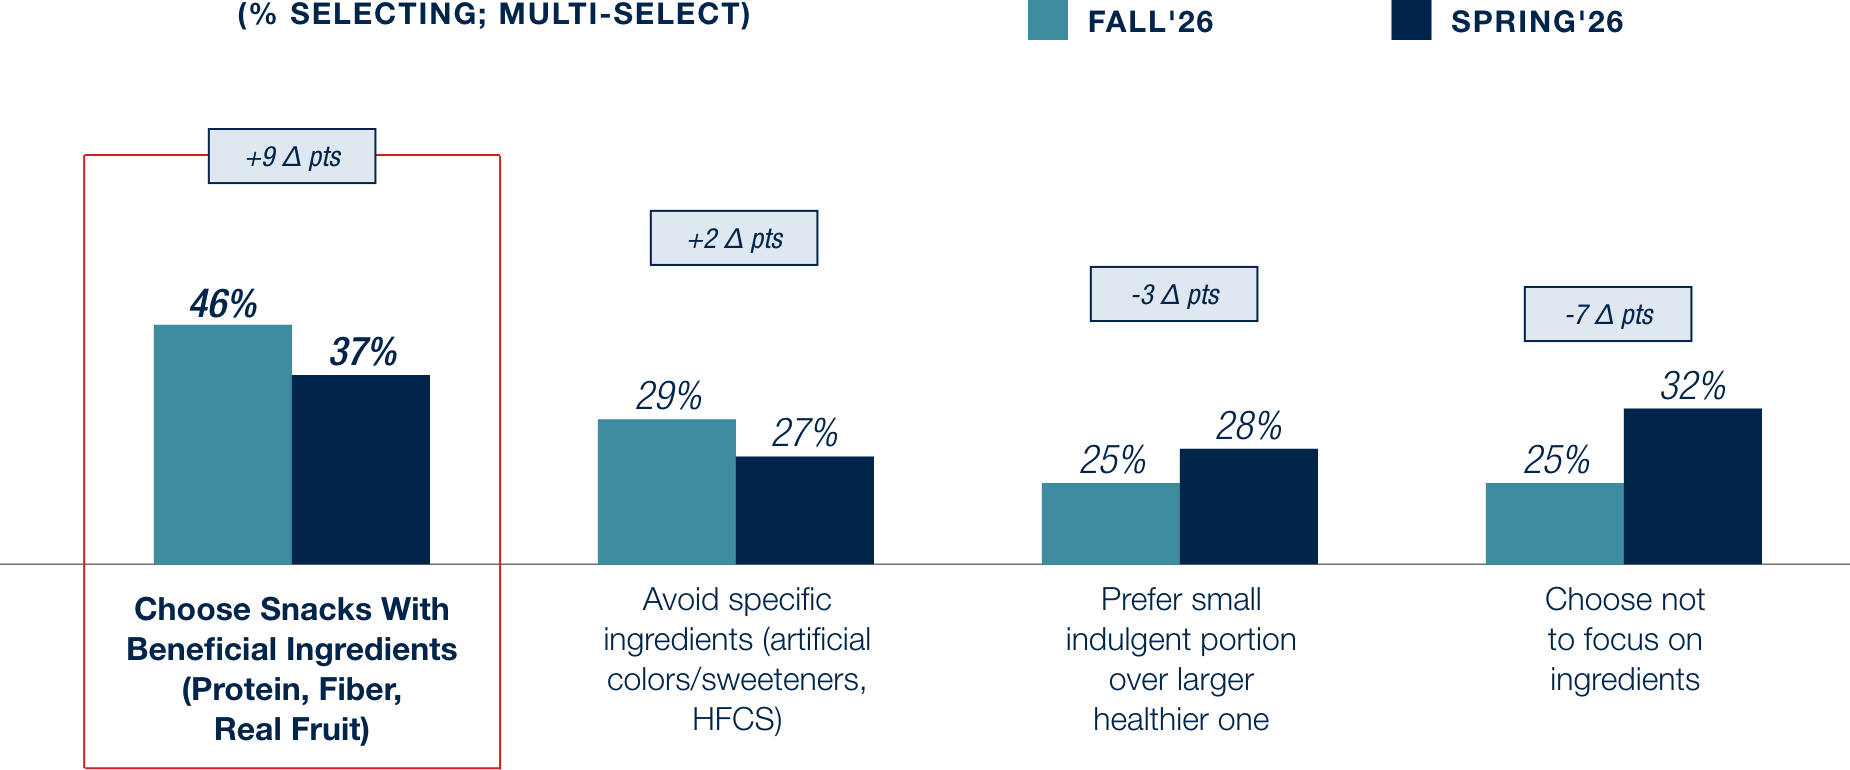
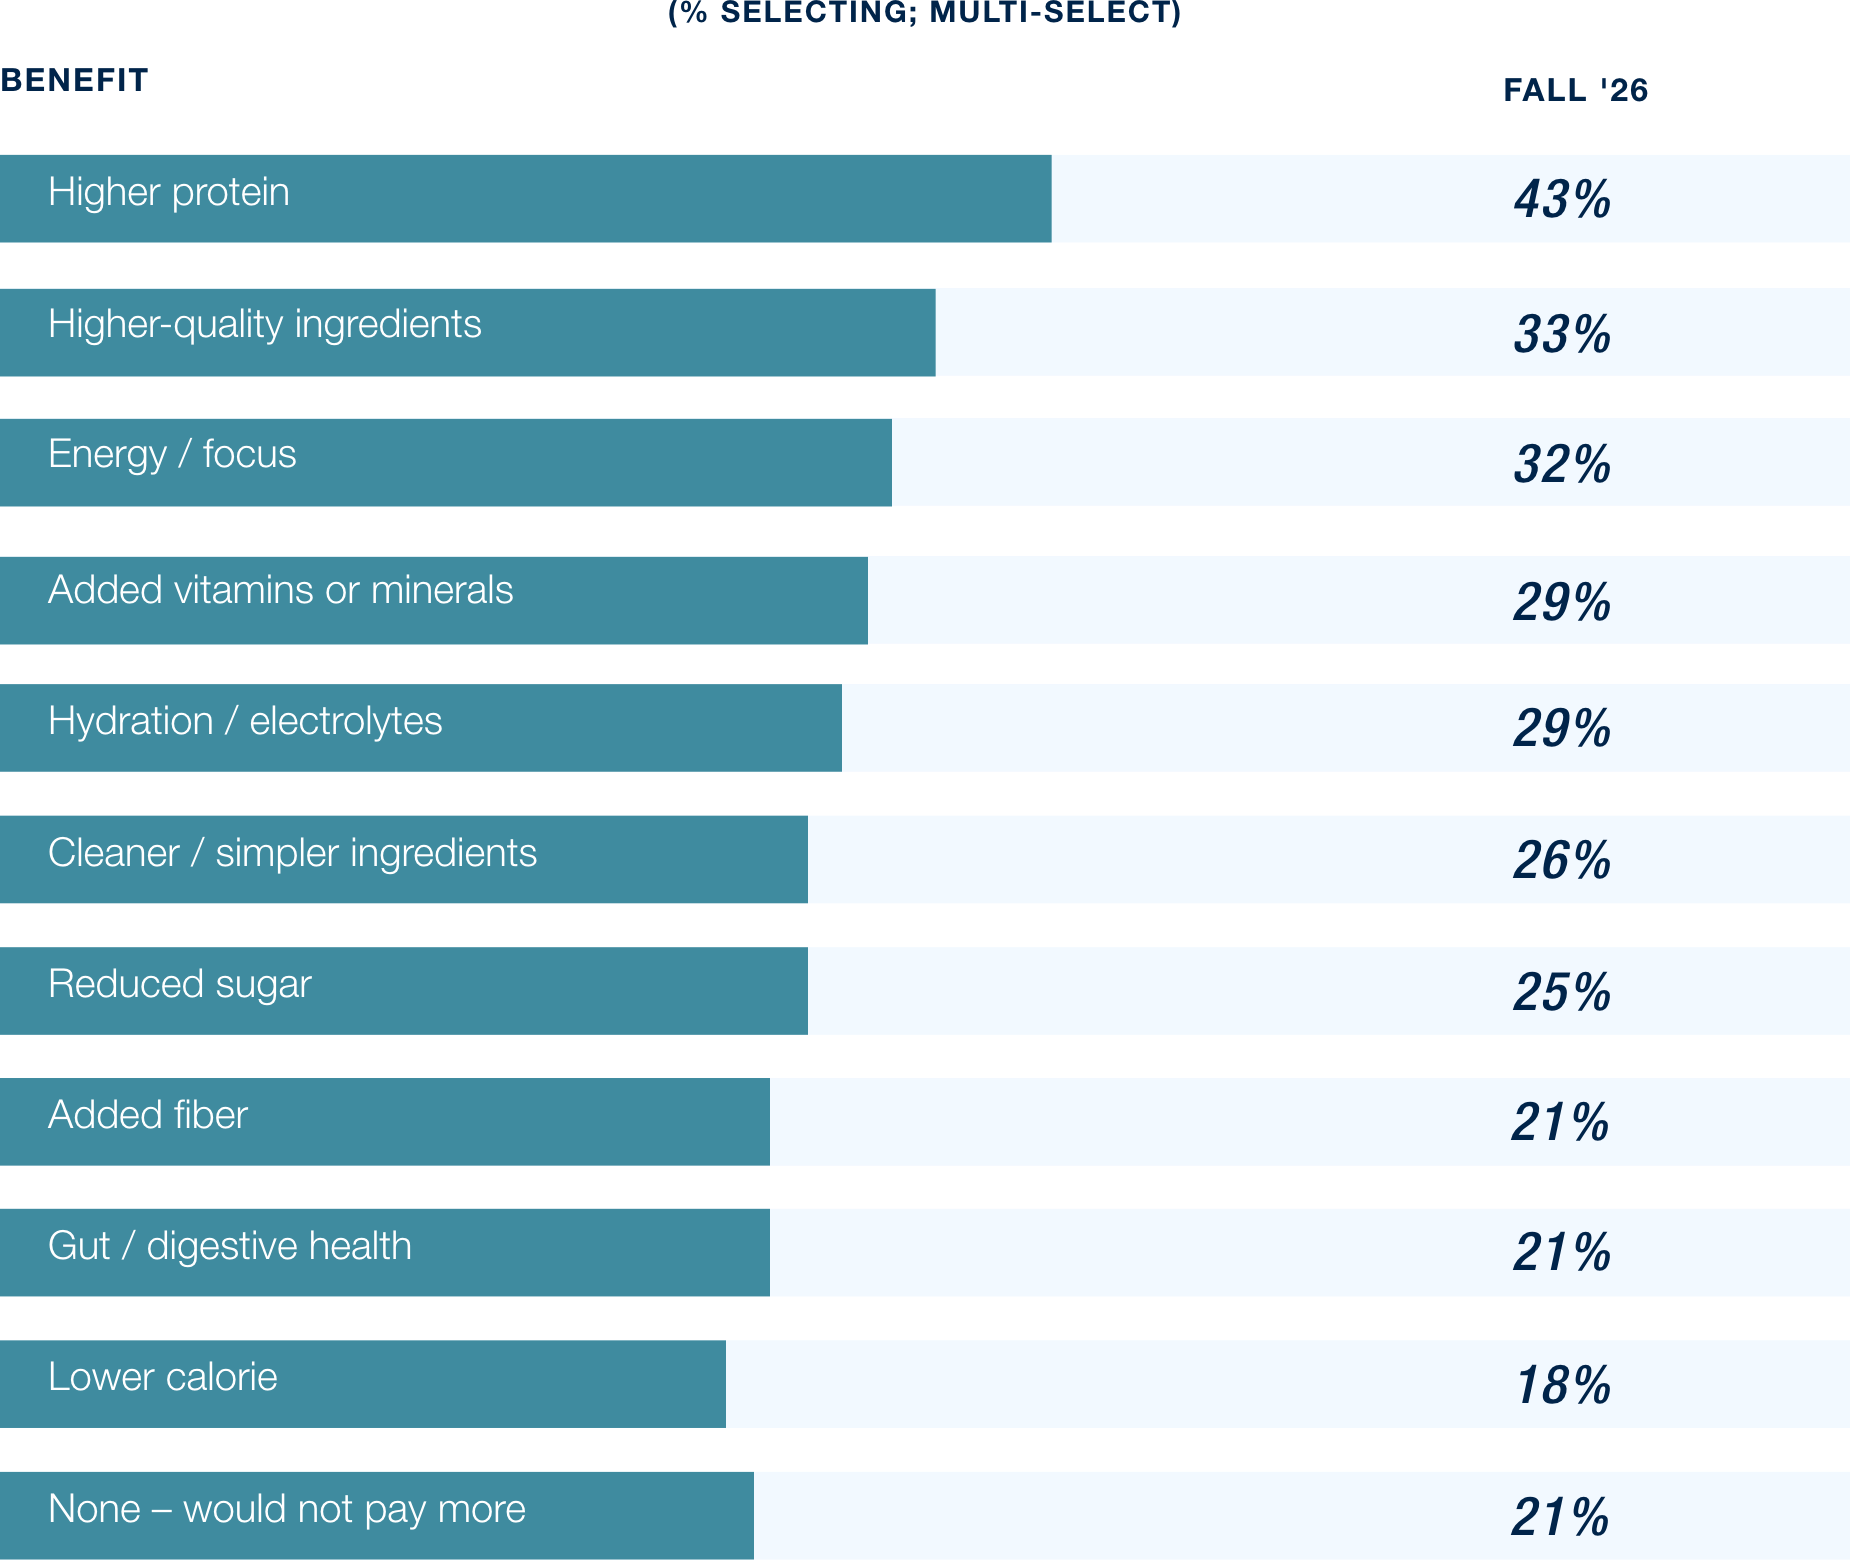
Snack and beverage behavior suggests what “quality ingredients” means to shoppers: the presence of beneficial ingredients rather than the absence of unwanted ones. 46% choose snacks with beneficial ingredients such as protein, fiber and real fruit, versus 29% who screen out ingredients they want to avoid, such as artificial colors and high fructose corn syrup. Higher protein (43%) and higher-quality ingredients (33%) top the benefits shoppers say they would pay more for, ahead of cleaner or simpler ingredients (26%). Higher-income households lead on willingness to pay, with 46% saying they would pay more for higher-quality ingredients versus 28% of households below $100K. Preferences also differ by age: shoppers 45+ lean toward taste (58% vs. 46% of under-45s), while under-45s place more weight on look and presentation (+12 pts) and health and nutrition (+11 pts).
What Makes “Premium Pricing”
Worthwhile When Grocery Shopping
Color from snacks & beverages –
what “quality ingredients” looks like
Value Without Compromise | Beauty
In Beauty, Discovery Is Everywhere But Purchase Is Consolidating At Mass Retailers
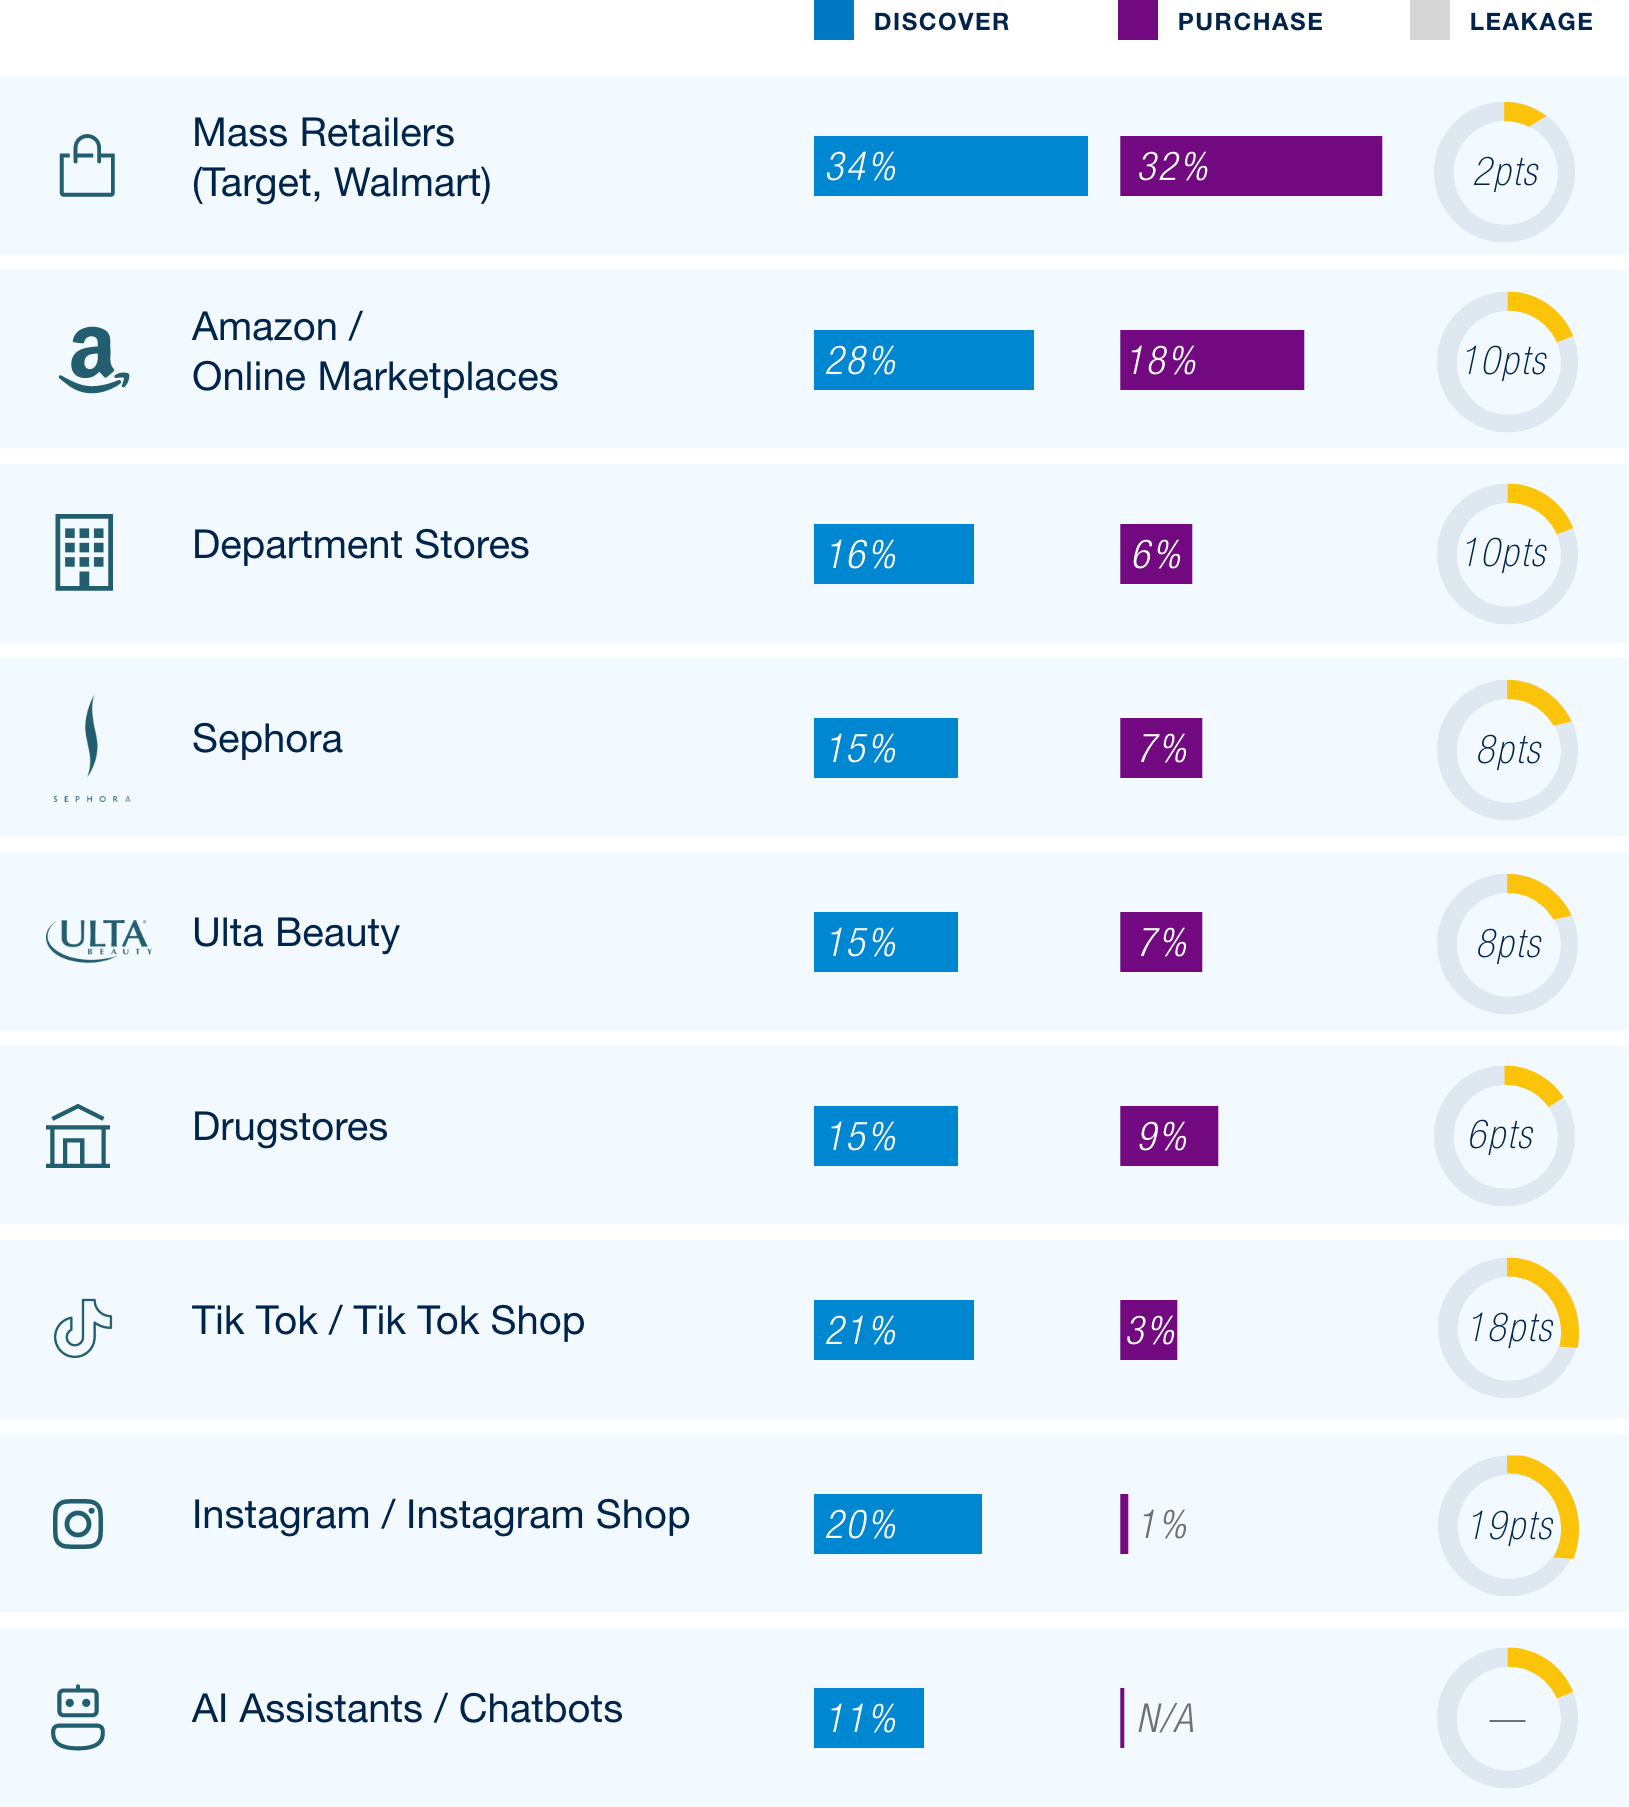
Beauty shoppers discover products in many places but buy in far fewer. Mass retailers like Target and Walmart are the only channel where discovery and purchase are nearly equal (34% vs. 32%). Specialty, department store, and social channels inspire far more than they convert. TikTok and Instagram each drive roughly 20% of discovery but capture just 1-3% of purchase.
This “research broadly, buy at value” pattern fits a weak category outlook. Spending intent is net-negative (-10%), improved from spring, and sharply split by income, with higher-income households planning to spend more and lower-income households planning to pull back.
AI is emerging as a real discovery channel. 11% of consumers use AI assistants to find beauty products, rising to 22% among higher-income households, on par with Ulta and Sephora. Men are nearly twice as likely as women to use it (15% vs. 8%), making AI a possible on-ramp to an audience the category has struggled to reach.
Beauty Discovery vs. Preferred Purchase Channel
Value Without Compromise | Apparel
APPAREL CAUTION EASES AS AFFLUENT AND YOUNGER SHOPPERS TRADE UP AND DIVERSIFY CHANNELS

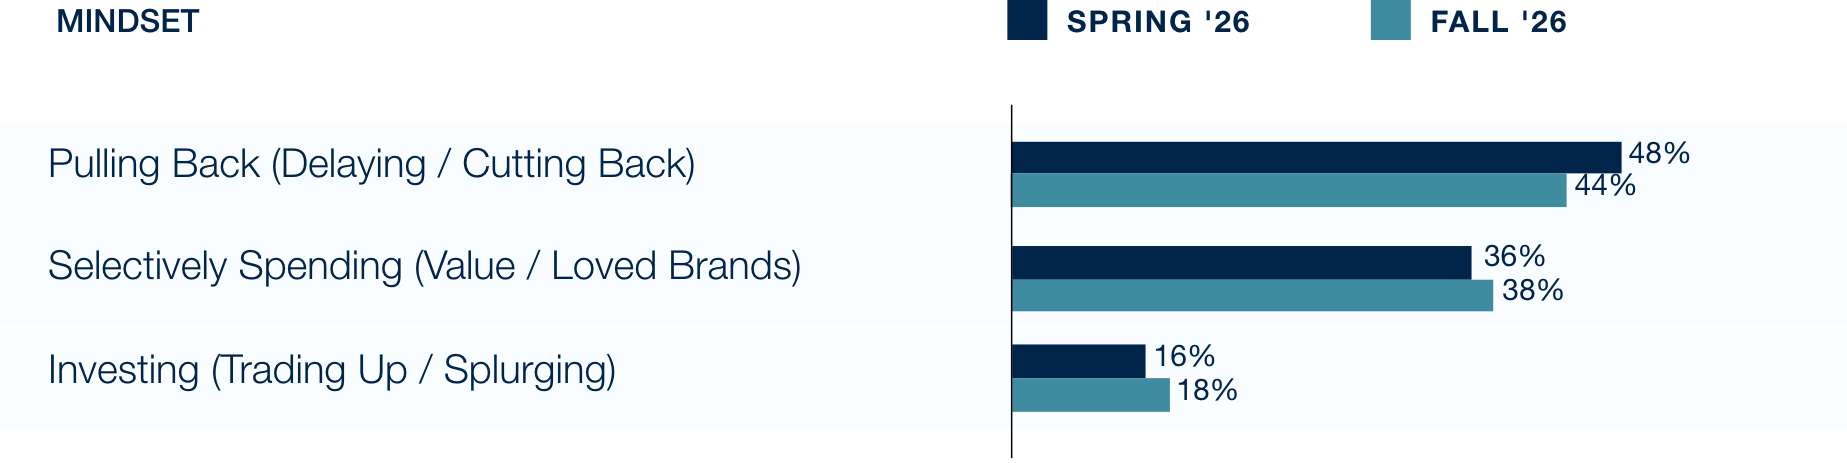
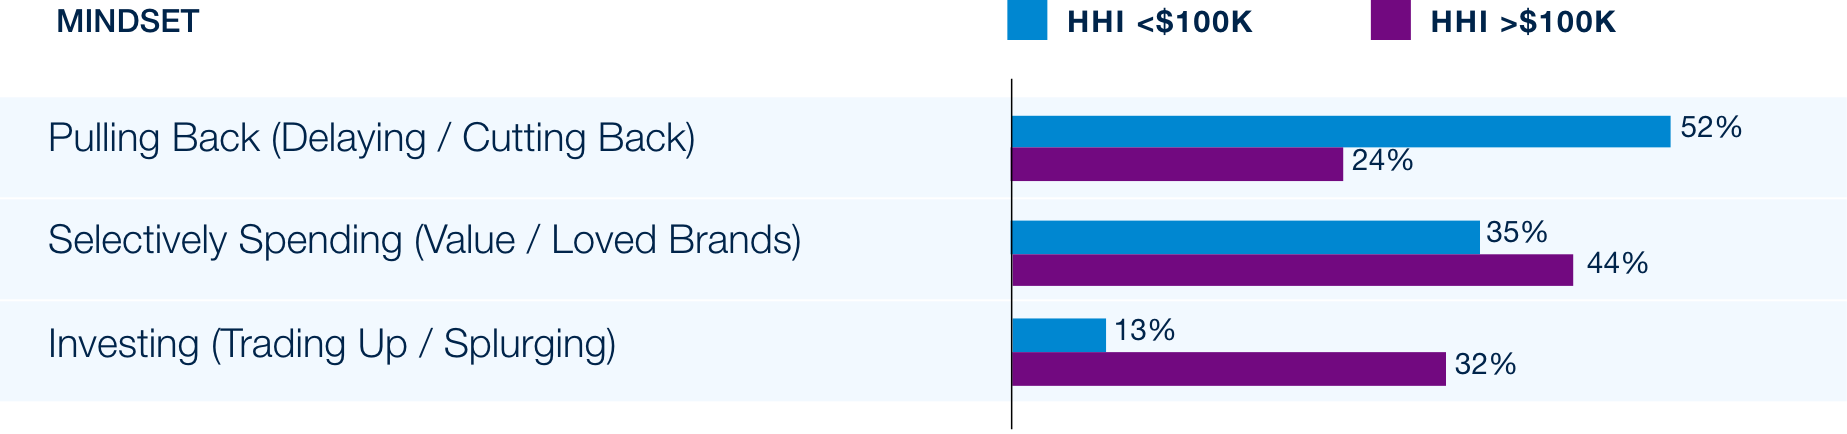
Apparel shoppers remain cautious, but the balance is shifting. Fewer consumers are pulling back (44%, down 4 points), while more are investing, driven by shoppers trading up for quality and longevity.
Mindset splits by income and age. Lower-income consumers are twice as likely to be pulling back (52% vs. 24%), while higher-income and under-45 consumers are far more likely to trade up. When shoppers do pay more, they point to fit and comfort, quality of materials, and durability.
Channels are diversifying. Online marketplaces and resale are the fastest-growing, while physical stores remain the largest but flat. Resale is no longer niche for younger consumers: just 18% of under-45s don’t shop second-hand, versus 46% of those 45+.
Consumers’ Current Mindset When Buying Apparel
Response By Household Income
Wellness Rewrites The Basket | GLP-1
WITH SMALLER APPETITES, GLP-1 USERS ARE REBUILDING THE BASKET AROUND PROTEIN AND NUTRITION TO MAKE EVERY BITE COUNT
GLP-1 medications continue to reshape how a growing segment of consumers eats and shops. 22% of respondents report currently taking one, up from 18% in spring, and another 21% are considering it. Adoption skews younger and more affluent (36% of higher-income households vs. 17% of lower-income), yet interest is the same across income groups, suggesting cost and access, not appetite, are holding back broader adoption.
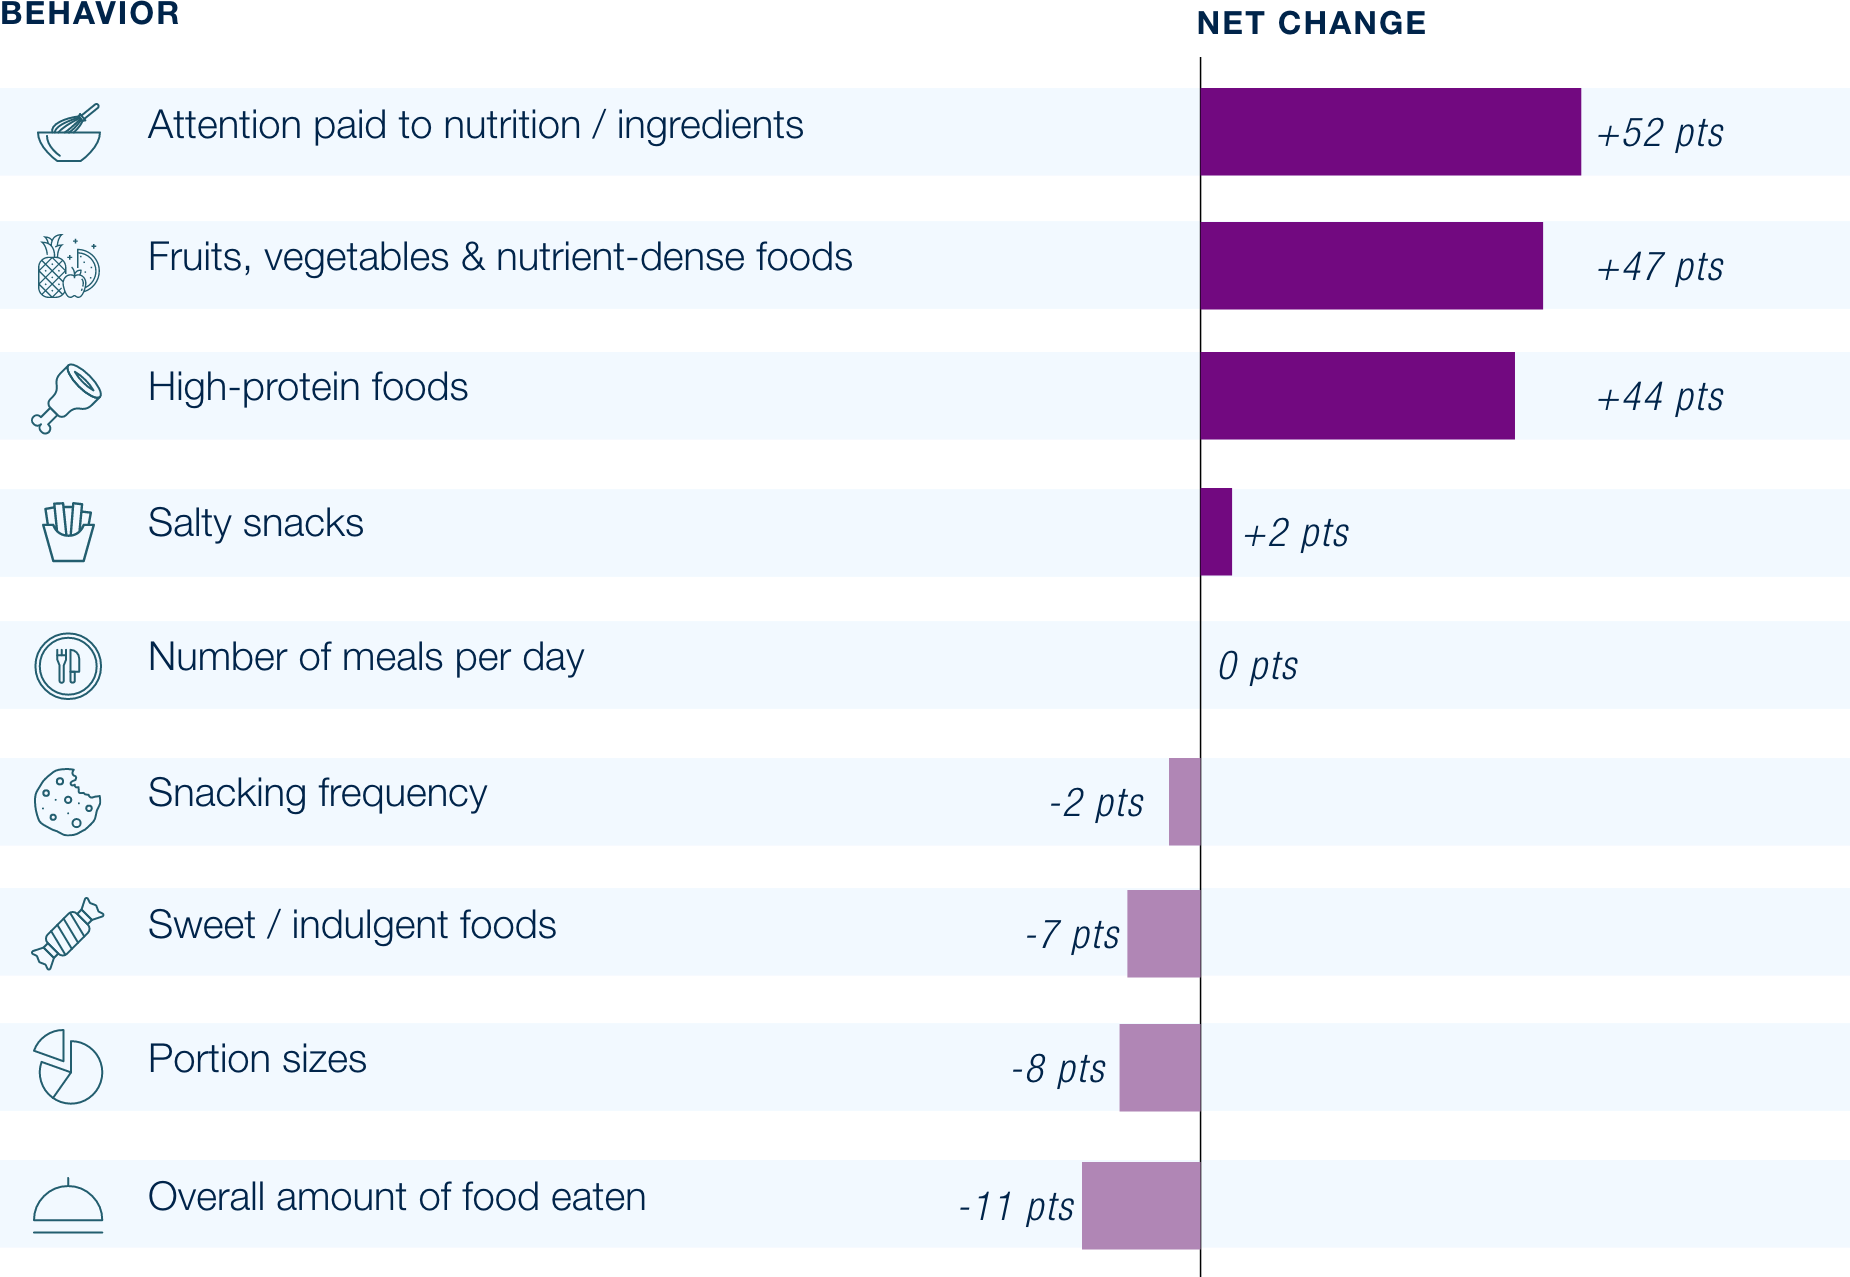
Reduced appetite is driving a more selective basket. With smaller portions (-8 pts) and less food overall
(-11 pts), users cut back on indulgent foods (sweet -7 pts) and scrutinize what remains: attention to nutrition and ingredients is up 52 pts, fruits, vegetables, and nutrient-dense foods up 47 pts, and high-protein foods up 44 pts. Fewer bites means each one has to deliver more. High protein is now the most important food attribute for users.
The wallet impact extends beyond the grocery aisle. Users are spending more on vitamins, fitness, and wellness products to ensure nutrition and function with a smaller intake, while restaurants and alcohol, which can be lower in nutritional benefits are the only categories in decline. And the habits outlast the prescription: 88% of former users say at least one behavior has stuck.
Since Starting a GLP-1,
How Have the Following Changed?
– Net Change (Increased – Decreased), Current Users
GLP-1 USERS ARE STILL SEARCHING – RETAILERS AND BRANDS MUST MAKE RELEVANT OFFERINGS EASIER TO FIND AND CHOOSE
GLP-1 users are an addressable shopper, and they are still searching. 60% have already bought food or beverages marketed as “GLP-1 friendly,” including 30% who buy them regularly, yet 31% of users aged 45 and over have never seen these products, versus 6% of under-45s. Retailers and brands that make GLP-1-relevant offerings easy to find through shelf callouts, dedicated sections and targeted outreach can capture demand that is already looking for them.
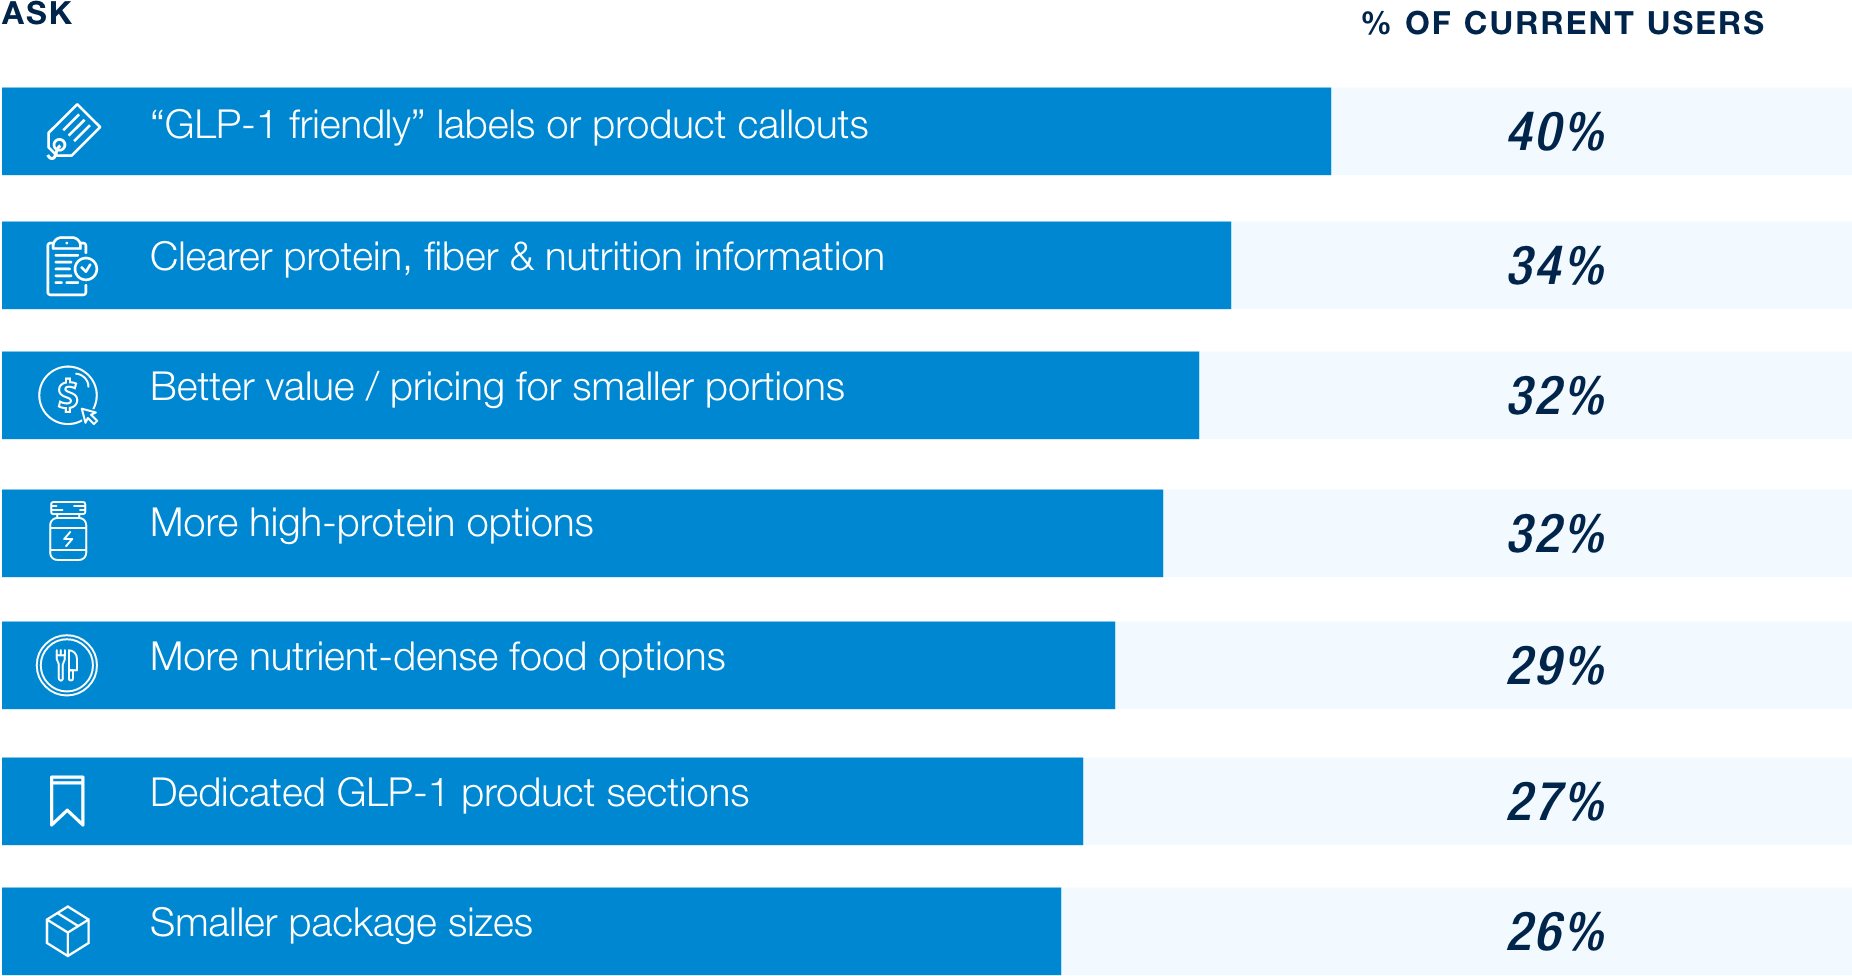
Beyond visibility, users want clarity, the most common ask is simply clearer labels and callouts (40%). They want GLP-1-friendly labels with clearer nutrition information (34%), and better value on smaller portions (32%). Smaller formats are preferred by most (68%), while few favor larger value sizes.
The impact reaches beyond food. In restaurants, users are choosing healthier options, taking leftovers home, and ordering smaller meals. In apparel, many are delaying purchases while their size changes. GLP-1 users are also among the least brand-loyal shoppers: half frequently trade up to higher-priced grocery brands, versus 23% of consumers who have never used or considered a GLP-1.
What Would Make Shopping Easier for GLP-1 Users
Wellness Rewrites The Basket | Snacks & Beverages
WELLNESS AND FUNCTIONAL BENEFITS ARE BECOMING MORE IMPORTANT IN SNACKS AND BEVERAGES
Wellness is becoming a measurable habit and a paid-for attribute, with consumers pointing to what they want in the product rather than what’s removed. More shoppers are screening snacks for beneficial ingredients, and more are reaching for hydration, protein and energy beverages. Shelf space, innovation and price-pack architecture should lean toward “what is in” claims, rather than reduction claims (sugar, calories).
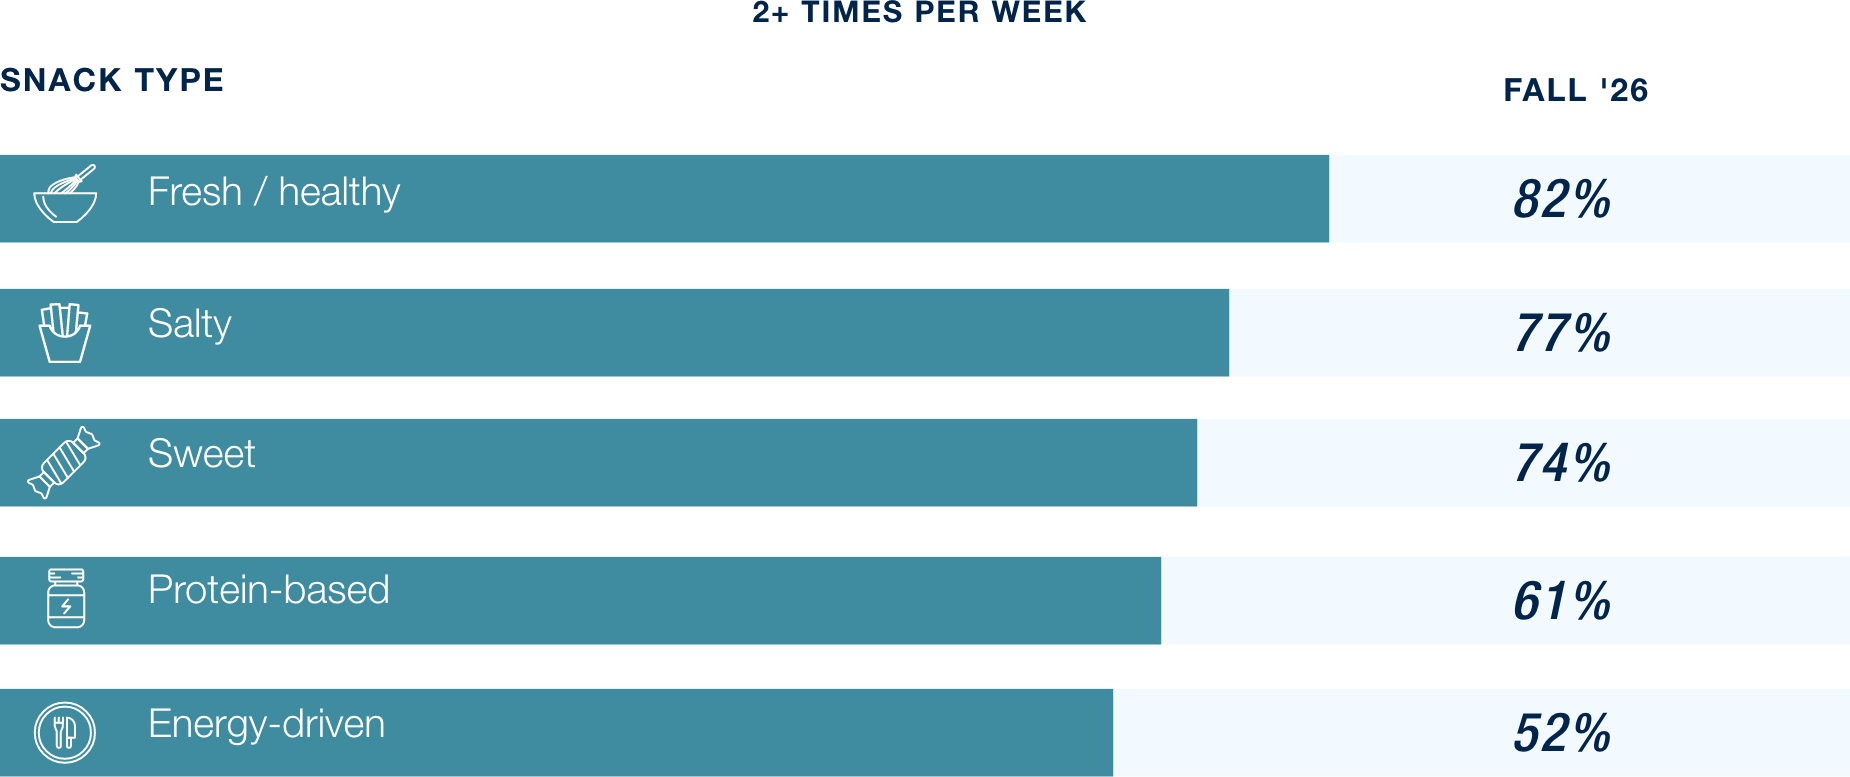
In snacks, health-led choice is displacing indifference. Fresh/healthy leads, and protein-based and energy-driven snacks are already weekly habits for a majority of consumers. Shoppers are selecting for beneficial ingredients far more than screening out unwanted ones, while indifference to ingredients is falling. About 4 in 5 will pay more for at least one benefit, with protein leading by ~10 pts. Additive benefits (protein, energy, vitamins, hydration) outrank subtractive ones (reduced sugar 25%, lower calorie 18%).
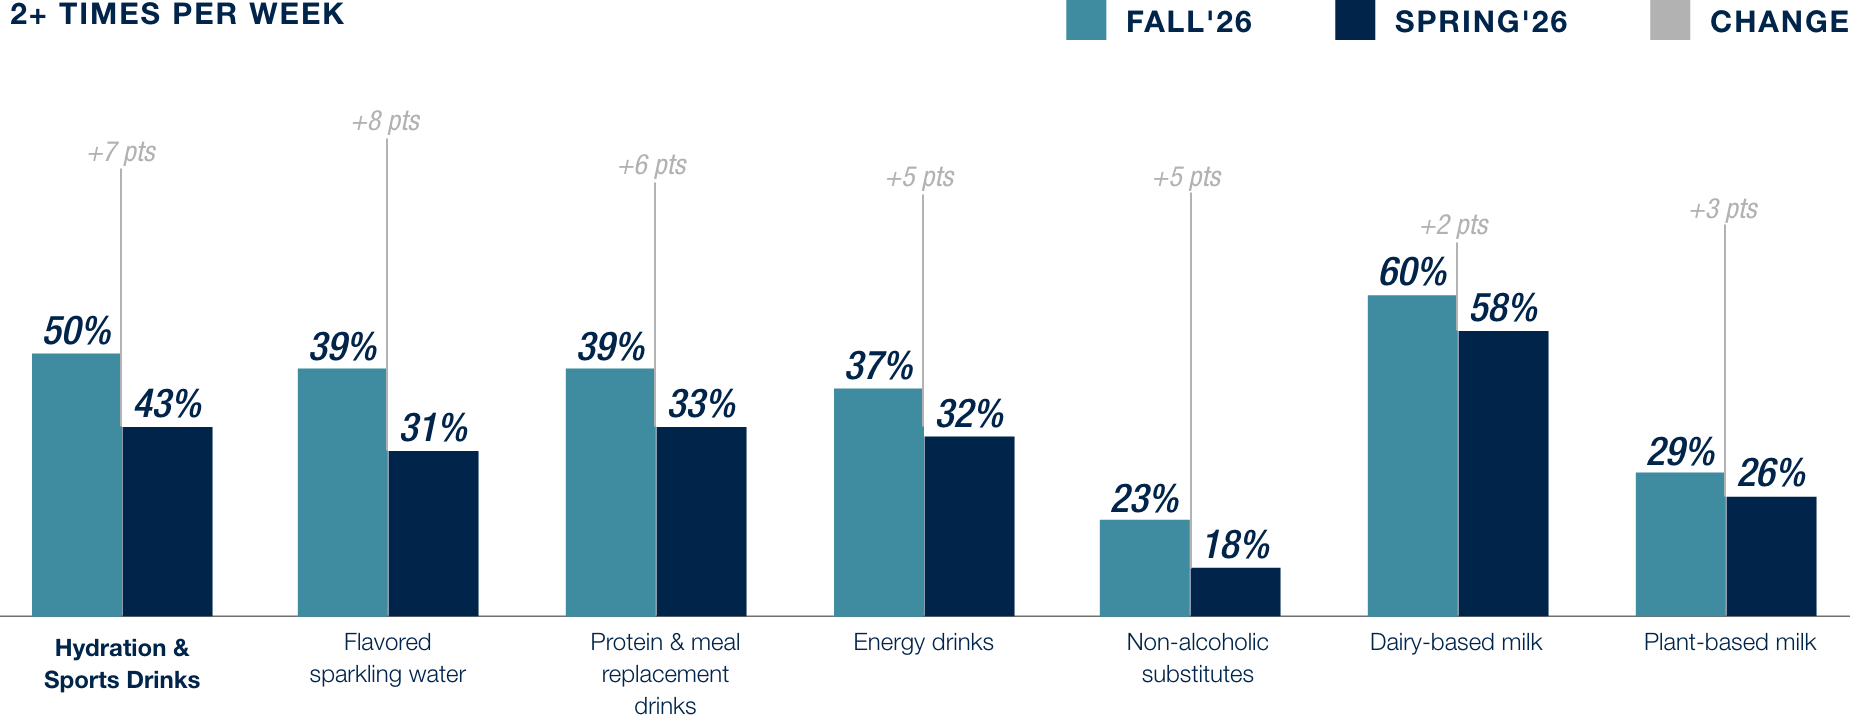
In beverages, regular consumption (2+ times per week) rose across every beverage type measured versus spring, but growth is led by flavored sparkling water (a potential soda substitute), hydration and sports drinks, protein drinks and energy drinks.
Snacks Consumption
How consumers weigh snack ingredients
Benefits consumers will pay more for in snacks / beverages
Beverage Consumption
The Evolving Role of Technology | AI
CONSUMER CONCERNS REGARDING AI ARE NOT CHANGING BUT RELIANCE ON AI FOR DECISION MAKING IS INCREASING DESPITE CONCERNS
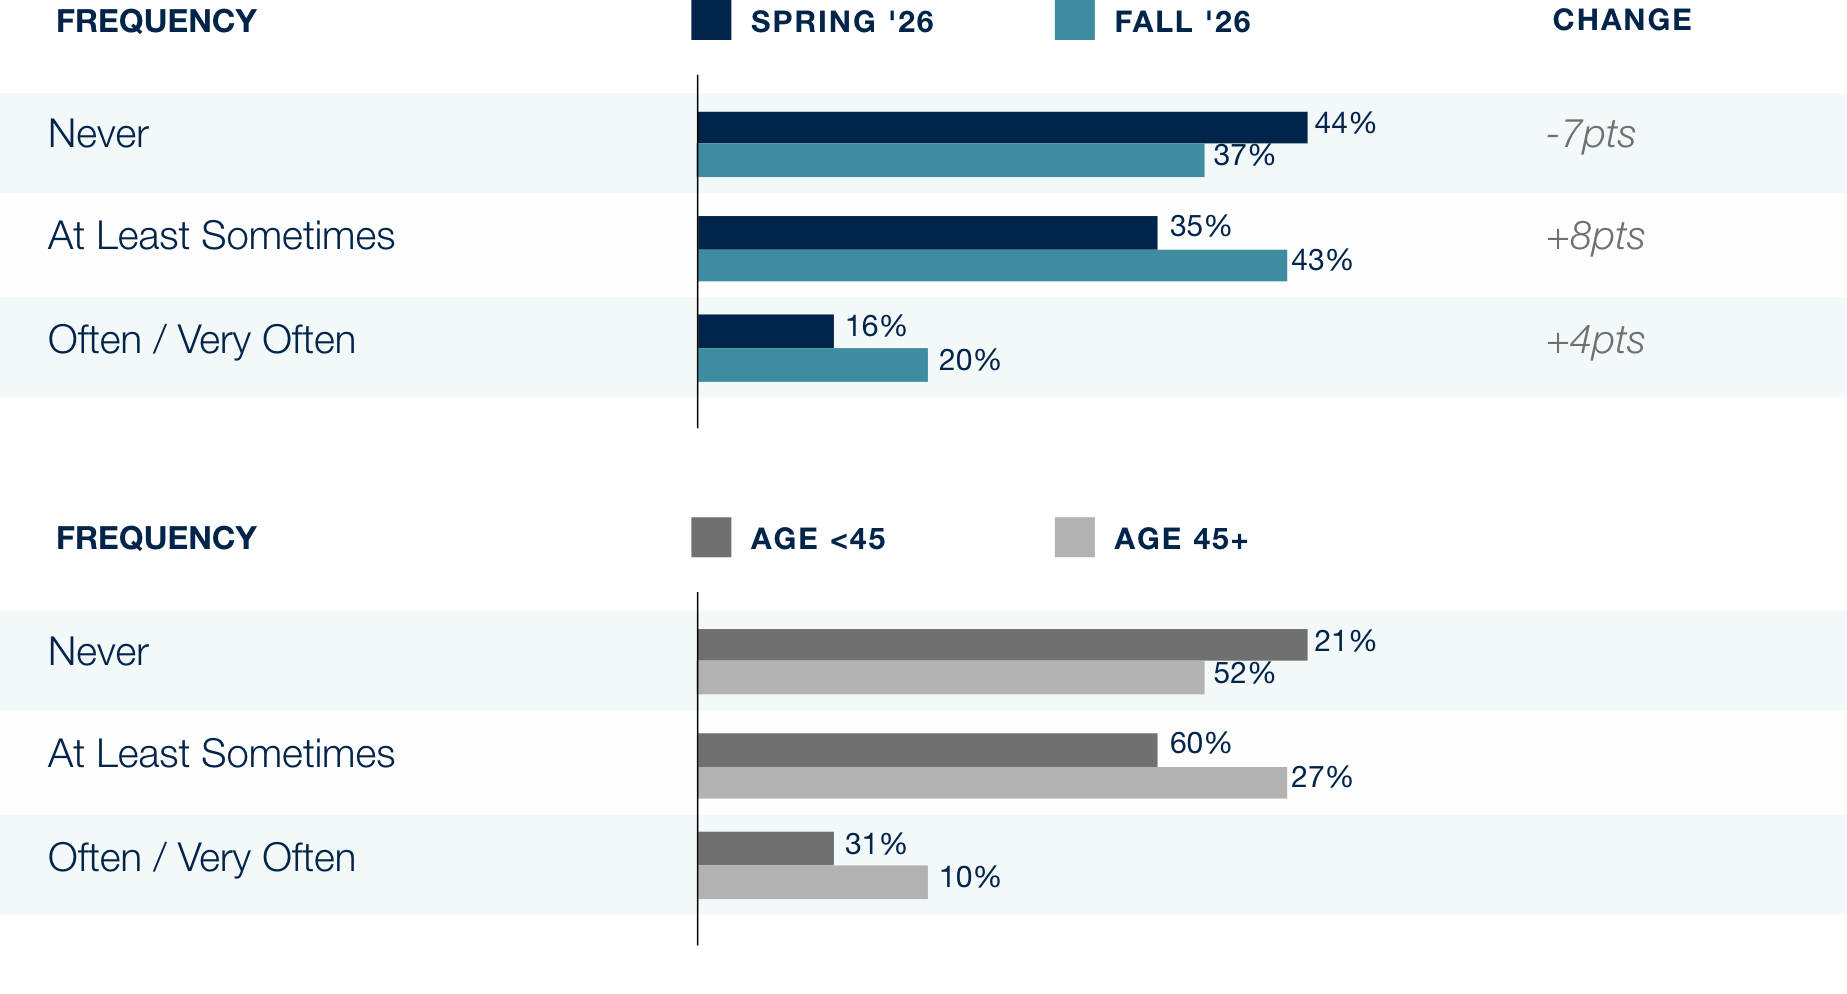
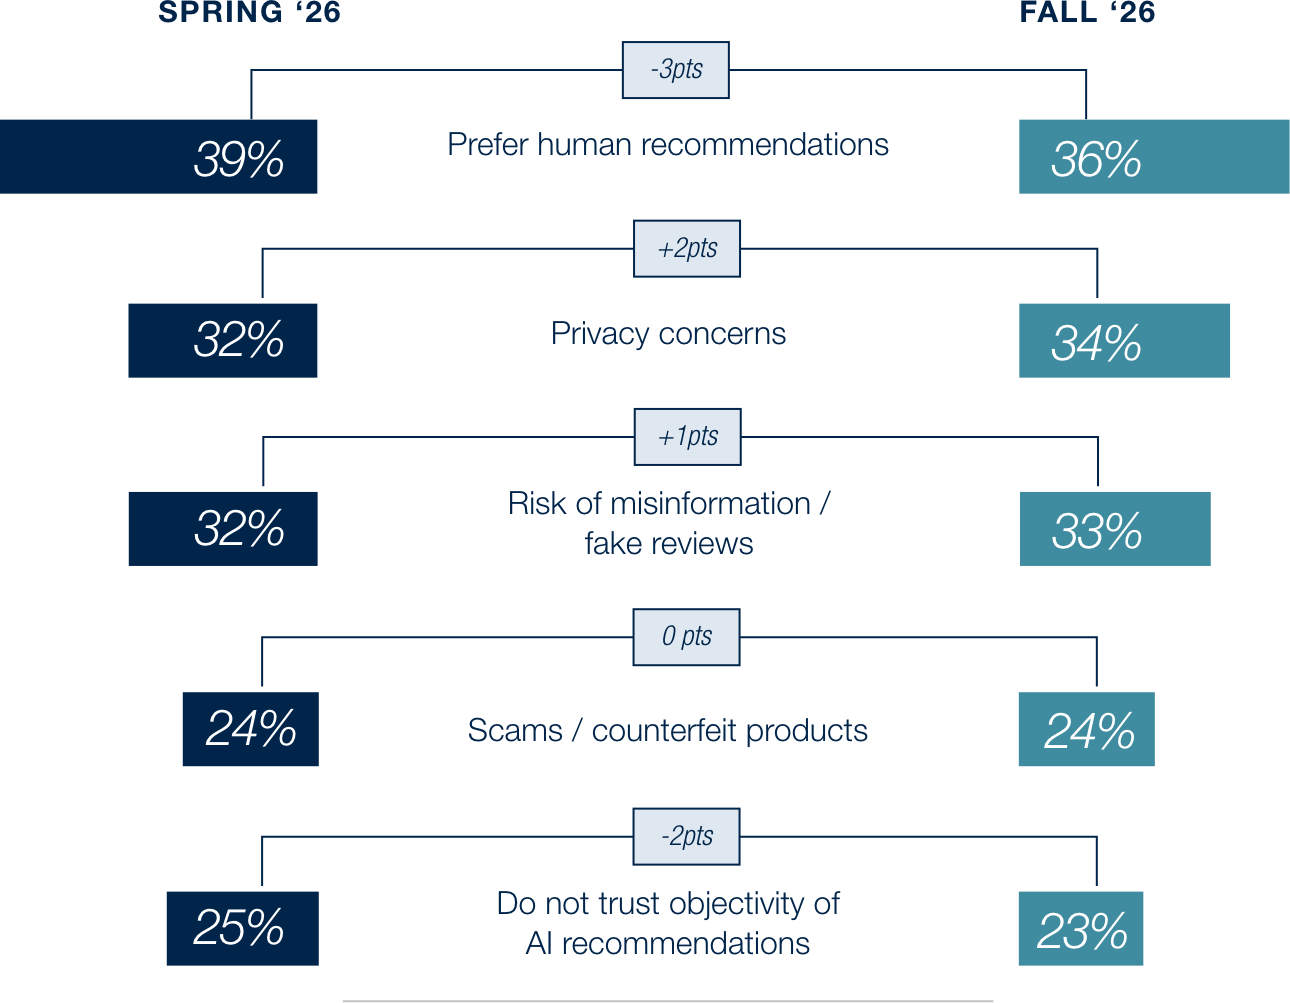
Skepticism has not eased. Privacy (34%) and misinformation (33%) concerns are flat to slightly up since spring, and 36% still prefer human recommendations. Yet, consumers are increasingly letting AI shape what they buy, 43% now let AI influence their final purchase decision at least sometimes (up from 35%, in spring), and those who never rely on it fell from 44% to 37%.
Concerns differ by age. Younger consumers question AI’s execution, citing unverifiable sources and generic recommendations. Older consumers question AI itself, with preference for human recommendations and distrust of objectivity highest among the oldest groups.
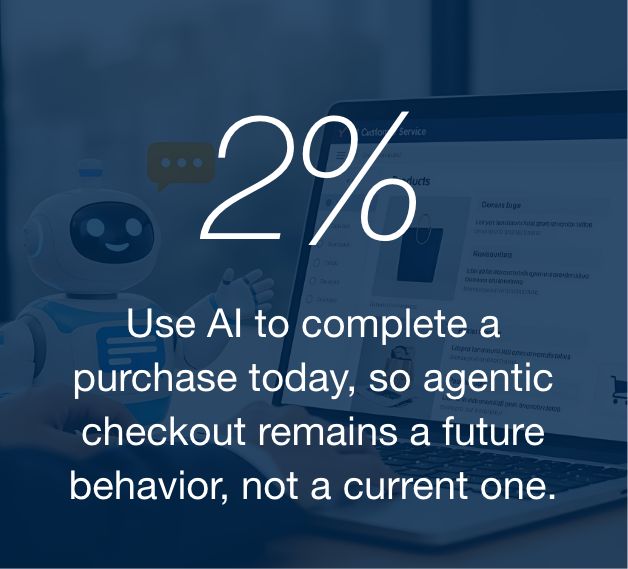
Consumers appear willing to accept the risk. Among those who rely on AI often or very often, concerns about privacy (37%), misinformation (35%) and scams (29%) are as high as or higher than among non-users, so heavier use is not coming from greater trust. Price and value is where consumers lean on AI most: comparing prices and value is the top use in grocery, beauty and apparel. AI’s role is also moving down the funnel, with the use of AI to decide when to buy roughly doubling in grocery and beauty.

Adoption remains sharply divided. 60% of consumers under 45 let AI influence their final decision at least sometimes, versus 27% of those 45+. Higher-income households show a similar lead over lower-income households (69% vs. 34%).
Reliance on AI in final purchase decisions is rising
Consumer Concerns Around AI
How Consumers Use AI When Shopping
At which point in the shopping journey is ai leveraged
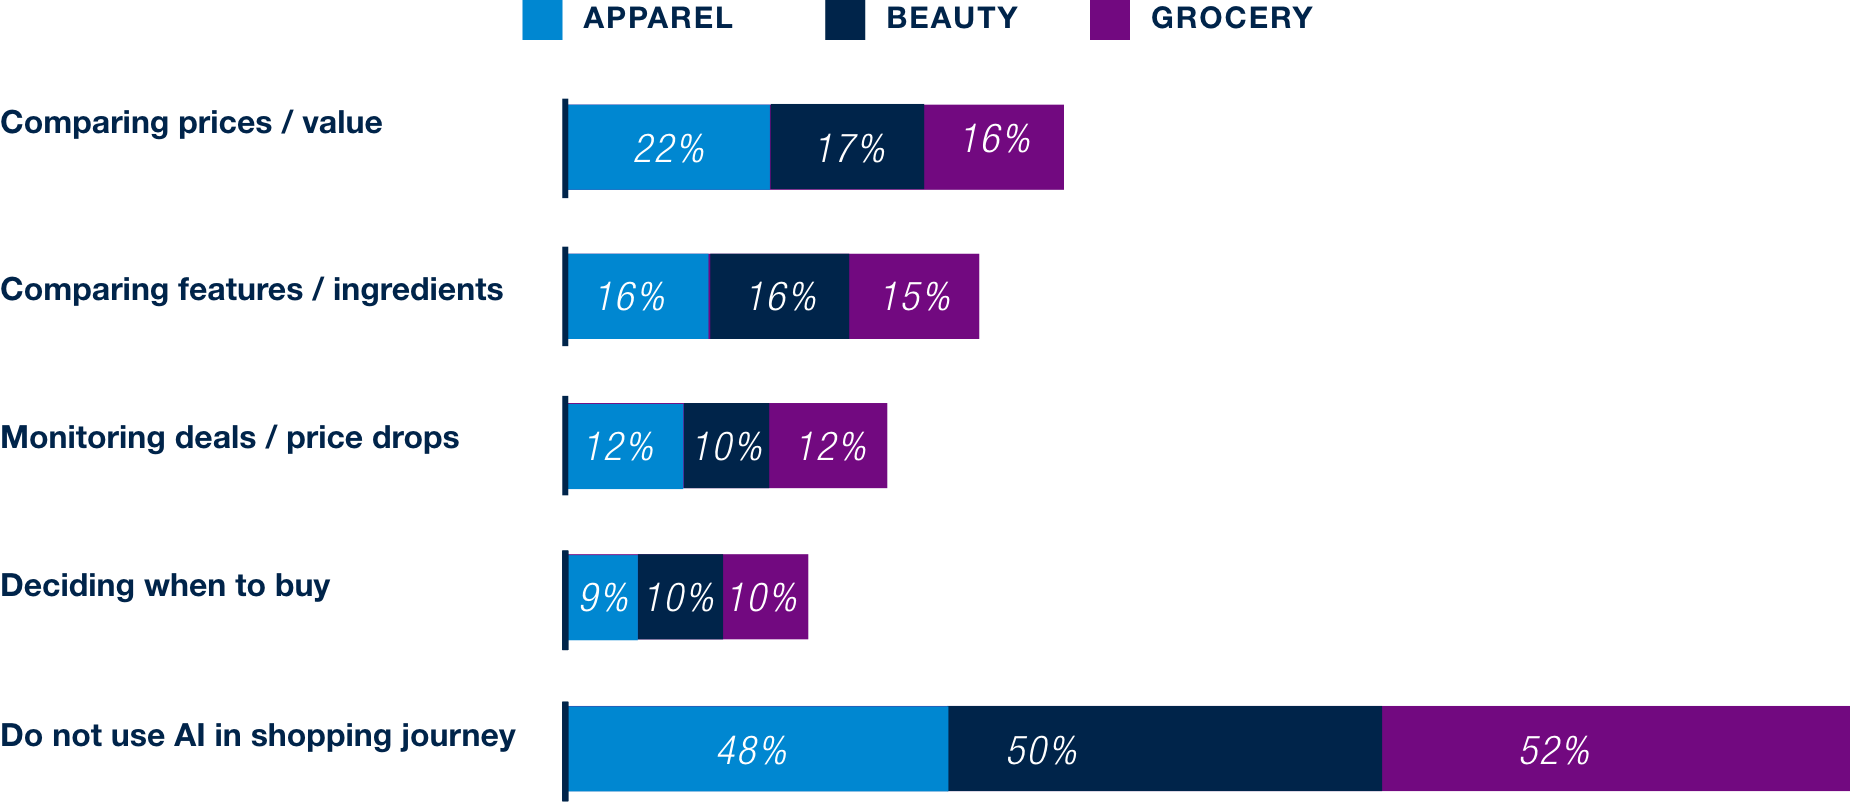
Consumers Not Using AI in Their Shopping Journey
The Evolving Role of Technology | OmniChannel
OMNICHANNEL CATCHES THE STORE AT CHECKOUT AS THE IN-STORE ADVANTAGE NARROWS
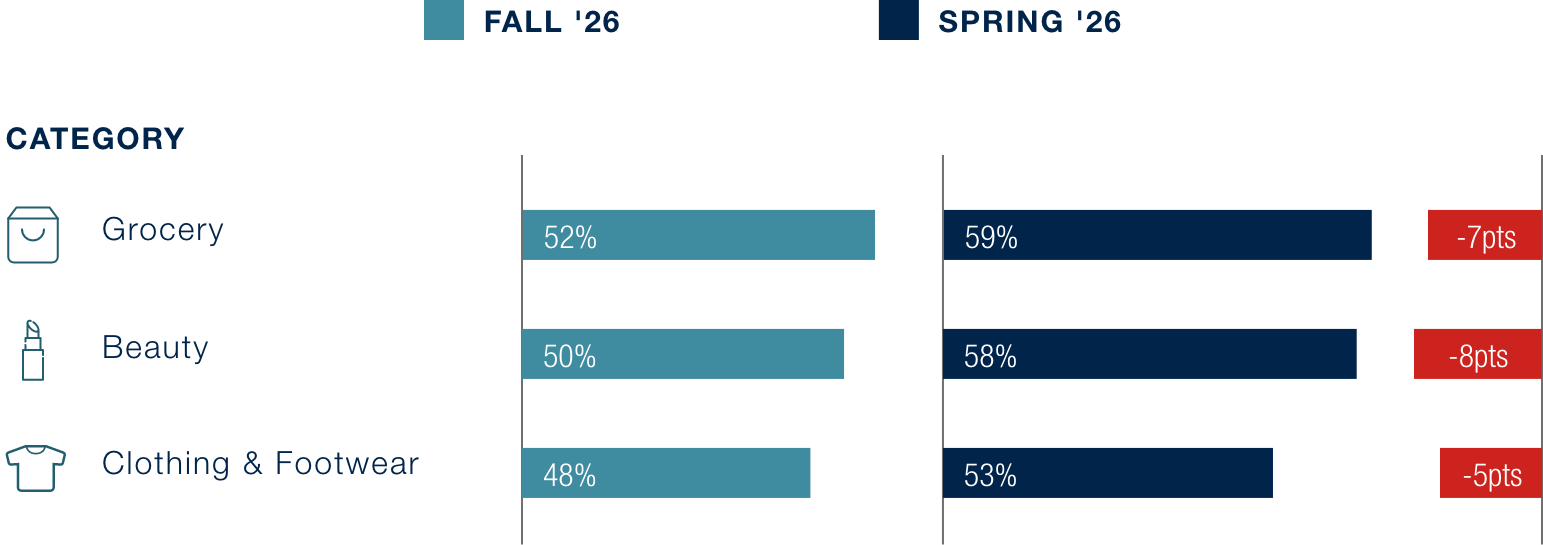
Digital continues to dominate the top of the funnel: 47% of consumers primarily research and compare products online, versus 19% in-store. But the bigger story this fall is at the point of purchase. Stores’ lead over online for final purchase has narrowed from 26 points in spring to 15, and a blended online-and-store purchase has caught up with in-store as the most common way to complete a purchase.
E-commerce adoption broadened across every category measured, with the share of non-users falling 5-6 points in all seven. Alcohol remains the clearest digital holdout, with just over half of consumers still not buying online.
Consumers aren’t choosing between channels, they want them to work together. 35% say their ideal experience is a seamless mix of online and in-store, up from 31%, and the preference is consistent across age groups.
Age tells the story at checkout.
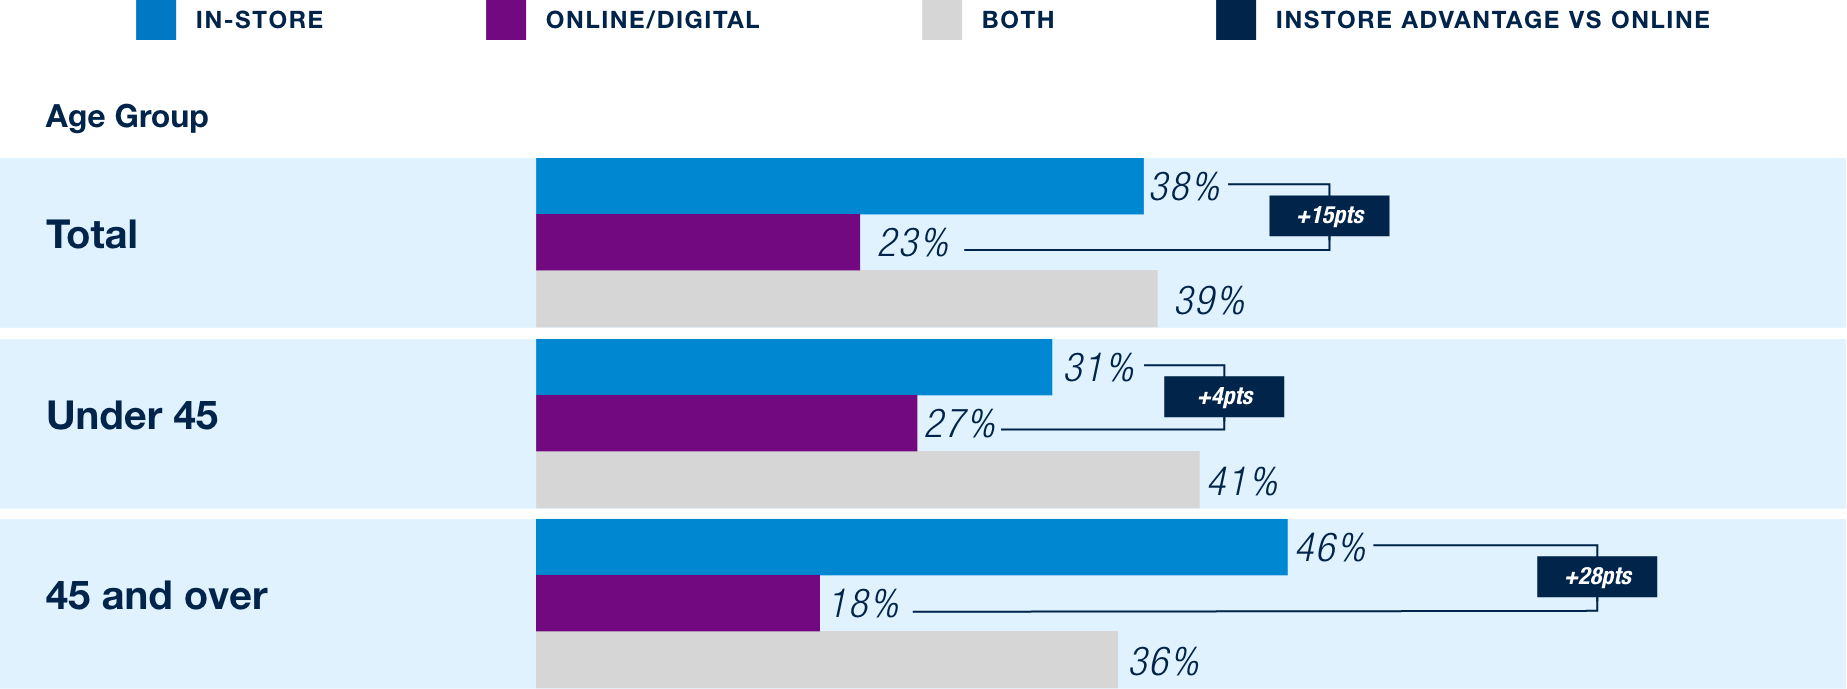
The in-store advantage is almost entirely an over-45 phenomenon: consumers under 45 are already omnichannel-first, with only 31% making the final purchase mostly in-store versus 27% mostly online and 41% using both equally (a 4-point store lead). Over-45s still anchor on the store (46% vs. 18% online, a 28-point lead), peaking at ages 65-74 (51% vs. 15%). Online-first purchasing is highest among 25-44 year-olds (28%), and 35-44s are the one group where in-store (29%) has effectively tied online. Yet the appetite for a seamless mix is flat across cohorts (32-36%), so the divide is in behavior, not preference.

Consumer Preferences When
Making Final Purchase for a New Product
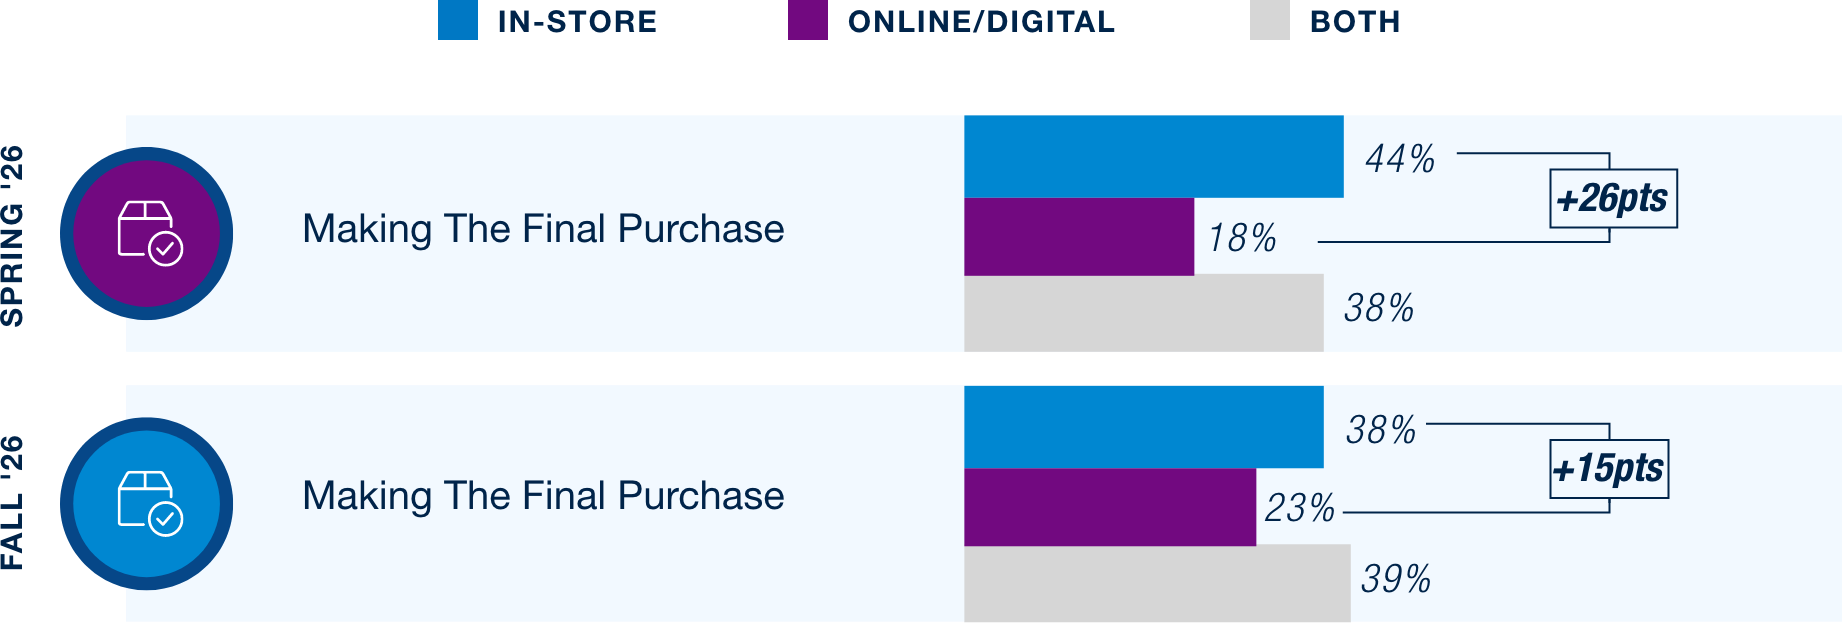
Final Purchase for a New Product by Age, Fall ’26
Emerging Themes To Watch
FOUR SIGNALS BENEATH THE HEADLINES THAT ARE WORTH TRACKING INTO SPRING ’27
1. Essentials are quietly crowding out discretionary recovery
Actual spend on gas swung from -12% to +3% net over the past six months, and utilities rose to +17%. Among lower-income households, utilities moved from -5% to +11%. At the same time, 20% of consumers would put a moderate income boost toward paying down debt – second only to groceries (22%). If energy and utility costs remain elevated, lower-income discretionary recovery may stall even as sentiment improves.
2. Premiumization is rising alongside value-seeking
The share of consumers frequently choosing a higher-priced brand over their usual preference rose in every category measured versus the spring: clothing & footwear (+6 pts to 25%), groceries (+4 pts to 33%), alcohol (+3 pts to 21%), restaurants (+2 pts to 27%), and beauty (+1 pt to 23%). Trading up is roughly twice as common among higher-income and under-45 consumers. The same shopper is increasingly trading down in commoditized baskets and up where quality is visible.
3. GLP-1 users are becoming a distinct, high-churn demand segment
Current GLP-1 users trade up in grocery at more than twice the rate of non-users (50% vs. 23%) and are far more likely to try new snack and beverage brands. With 21% of consumers still considering a GLP-1, this cohort is likely to become a larger swing factor in brand share across food, beverage, restaurants, and apparel.
4. AI as a discovery channel for under-served audiences
Men are nearly twice as likely as women to discover beauty products through AI (15% vs. 8%), and higher-income consumers already use AI for beauty discovery at parity with specialty retailers. AI may open doors to audiences that traditional category marketing has struggled to reach.
Methodology
Respondents matching U.S. adult population according to gender, age, ethnicity, region & income